Current signal generated on close of July 11
Past signals:
- Neutral signal generated on close of July 5
- Sell signal generated on close of June 24
today’s watchlist (potential trade entries):

Having trouble seeing the open positions graphic above? Click here to view it directly on your web browser instead.
open positions:
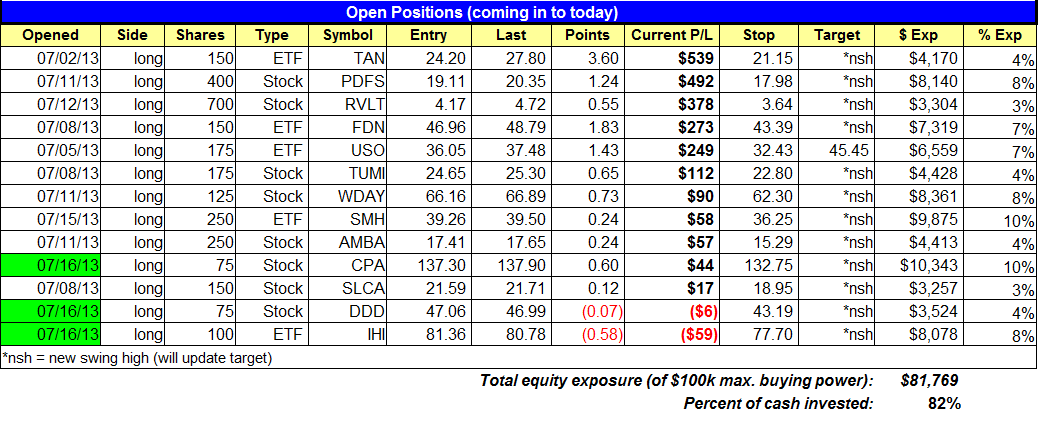
Below is an overview of all open positions, as well as a report on all positions that were closed only since the previous day’s newsletter. Net P/L figures are based a $100,000 model portfolio. Changes to open positions since the previous report are listed in pink shaded cells below. Be sure to read the Wagner Daily subscriber guide for important, automatic rules on trade entries and exits.

Having trouble seeing the open positions graphic above? Click here to view it directly on your web browser instead.
closed positions:

Having trouble seeing the closed positions graphic above? Click here to view it directly on your web browser instead.
ETF position notes:
- $IHI buy entry triggered on the open.
stock position notes:
- Buy entries in $DDD and $CPA triggered.
ETF, stock, and broad market commentary:
Stocks fell across the board yesterday on higher volume. Although losses were limited to the -0.2% to -0.6% range in the major averages, the higher volume selling produced a distribution day on the S&P 500 and NASDAQ Composite. This was the first sign of selling since the market rally began in late June. One day of selling is not enough to end a strong rally, but we could see a few days of sideways action. Leading stocks and market volume patterns are bullish, so overall, the market is in good shape.
There are no new ETF setups on today’s watchlist. Our ETF scans have dried up the past few days, as most ETFs (like the major averages) are extended and may need a few days of rest.
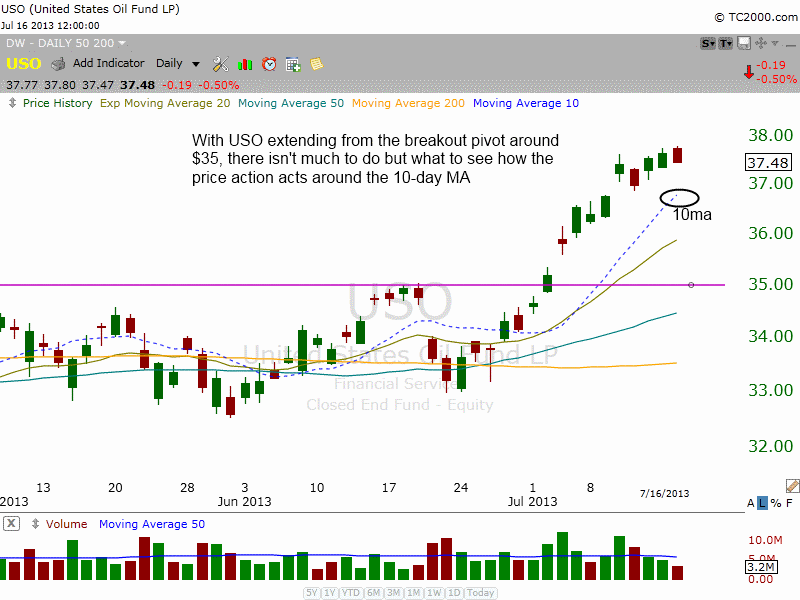
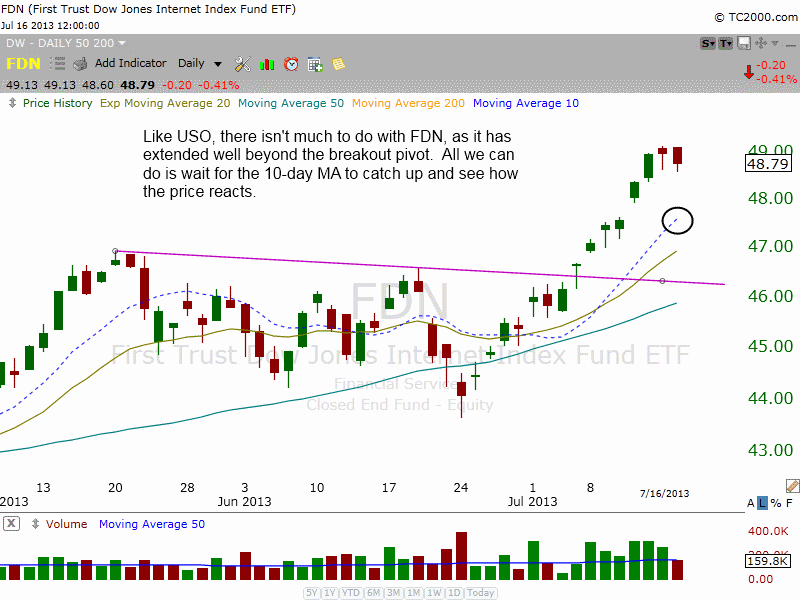
Our recent breakout entries in $USO and $FDN remain in great shape. Both ETFs have followed through to the upside nicely, and have extended well beyond their entry points. When an ETF or stock breaks out and runs higher for several days in a row, there is a temptation to sell right away and book profits. While it may be wise to take a quick profit from a swing trade entered on a short-term pullback in a uptrend, both of these ETFs have broken out from valid basing patterns and could run higher for several weeks before consolidating again. So there isn’t much to do now with either $USO or $FDN, as we wait for the 10-day MA to catch up to the price action.


On the stock side, we added two new positions to the portfolio yesterday in $DDD and $CPA. $DDD triggered on a pullback using a buy limit order, and $CPA broke out from a tight range on a nice pick up in volume.
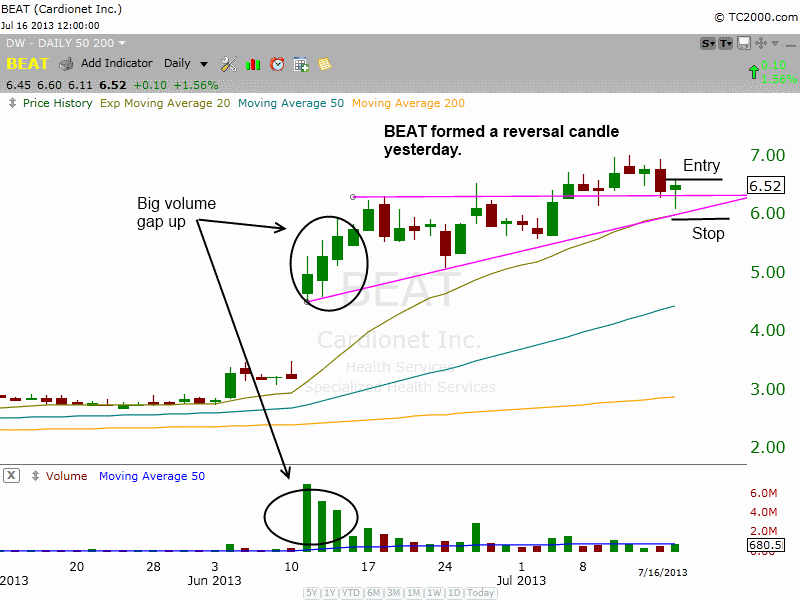
We have one new setup on today’s watchlist in Cardionet Inc ($BEAT). $BEAT has a relative strength ranking of 99, which is tops in the market and the best in its group of 24 stocks. There has been a big expansion in volume since the gap up in June, which is bullish. Yesterday’s bullish candle undercut the low of 7/9 before reversing to close back near the highs of the day. The buy entry is above yesterday’s high, and the stop is beneath yesterday’s low and the 20-day EMA. Note the reduced share size, as this is basically a GONG setup (Go Or No Go), which is what we call any setup that should move out right away and has a pretty tight stop.
