Current signal generated on close of July 11.
Portfolio exposure should at least be 75% to 100% long or more (if you can go on margin).
Past signals:
- Neutral signal generated on close of July 5
- Sell signal generated on close of June 24
today’s watchlist (potential trade entries):

Having trouble seeing the open positions graphic above? Click here to view it directly on your web browser instead.
open positions:
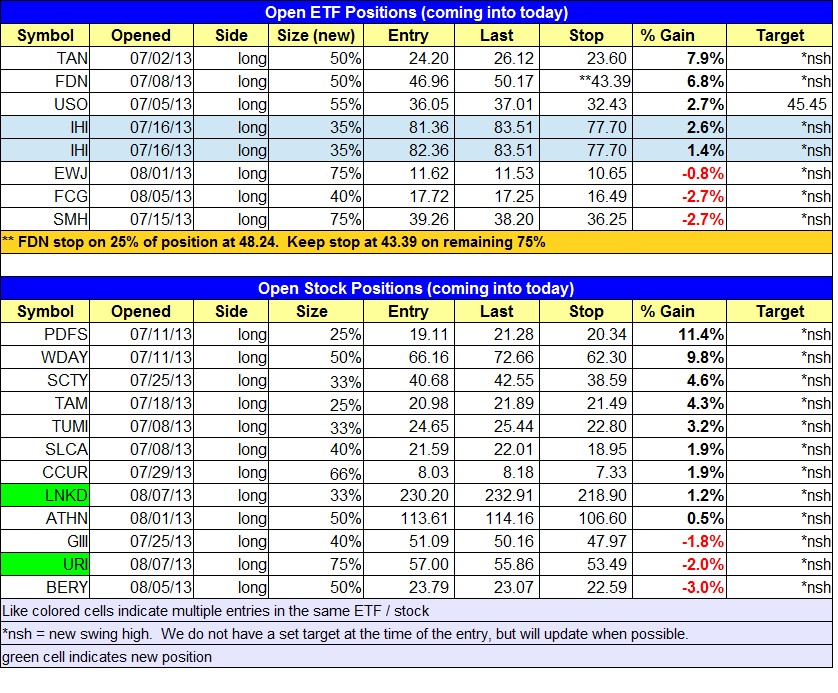
Below is an overview of all open positions, as well as a report on all positions that were closed only since the previous day’s newsletter. Changes to open positions since the previous report are listed in pink shaded cells below. Be sure to read the Wagner Daily subscriber guide for important, automatic rules on trade entries and exits. Click here to learn the best way to calculate your share size.

Having trouble seeing the open positions graphic above? Click here to view it directly on your web browser instead.
ETF position notes:
- No trades were made.
stock position notes:
- $DDD sell stop triggered for a 5% loss on very small position size (15% of max size).
ETF, stock, and broad market commentary:
Stocks retreated for the second day in a row, with small and mid-cap stocks down the most at -0.7%. By the close, losses were limited to just -0.4% on the S&P 500 and -0.3% on the NASDAQ. Total volume was heavier on the NASDAQ signaling yet another distribution day, however; the close was well off the lows of the day after undercutting the 10-day MA (so not a clear cut day of distribution). Lighter volume on the NYSE allowed the S&P 500 to escape distribution for the second day in a row.
The recent distribution in the NASDAQ is a concern, and we are beginning to see some leadership stocks break down. That being said, the majority of leadership is still acting fairly well, which leads us to believe that the current pullback in the major averages will be short lived. Market conditions can and do change quickly, so our analysis as always is good for today’s report only.
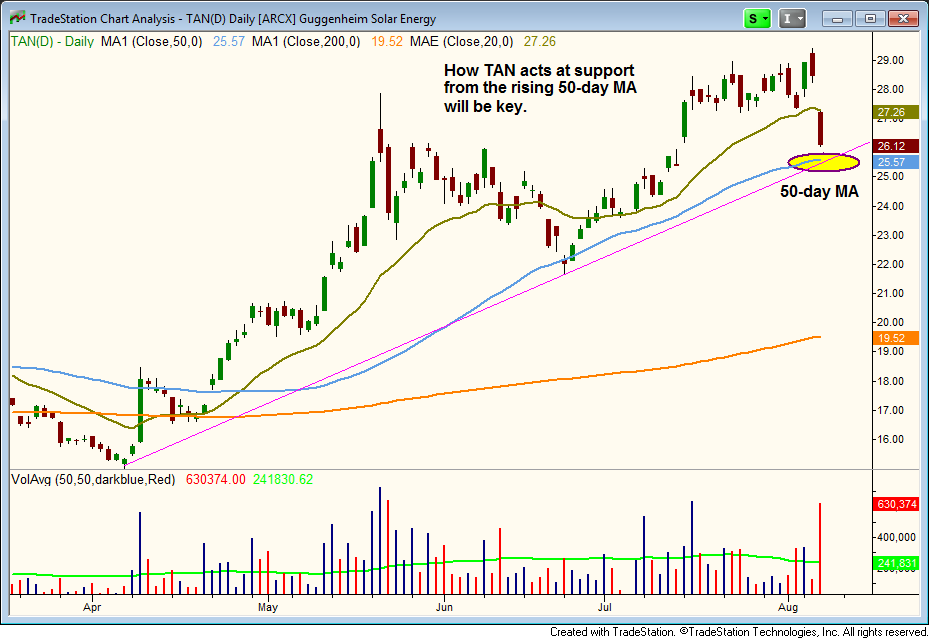
If was a rough day at the office for solar stocks yesterday, producing quite an ugly candle in $TAN on heavy volume. There is support from a short-term trendline and the rising 50-day MA around $25. We expect to see some sort of shakeout below the 50-day MA to occur within the next few days, but overall, we would like to see the price action hold above the 10-week moving average on a closing basis (on the weekly chart).

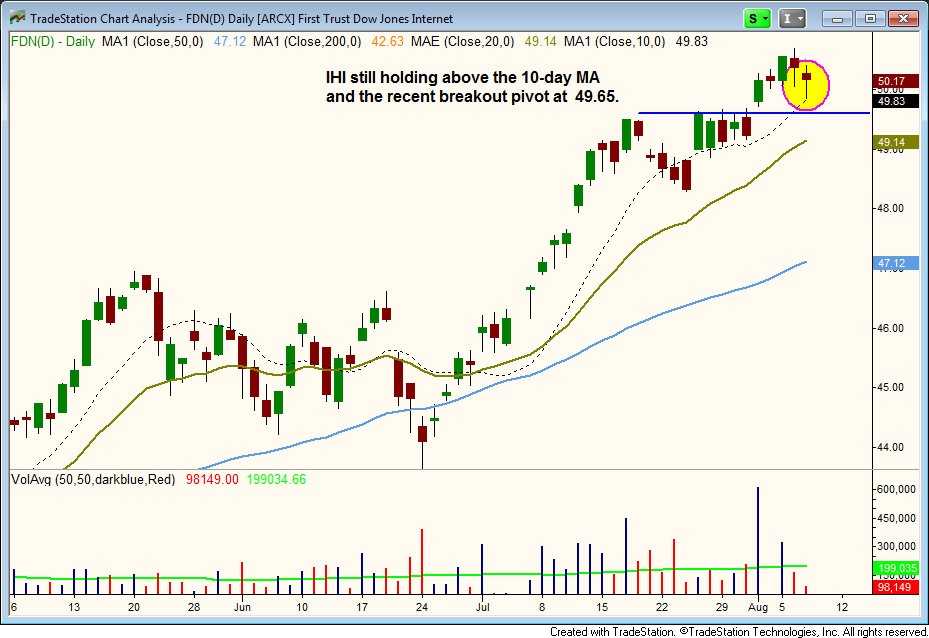
Looking our our current ETF holdings, $SMH, $FCG, and $USO are basically range-bound, while $IHI and $FDN continue to trend higher above the 10-day moving average. $FDN is still trading above the breakout pivot at 49.50, which is also a good sign, as a false breakout from a short-term consolidation in an extended stock or ETF can often lead to a sharp reversal.
The trend is our friend in $FDN…still above the 10-day MA.

On the stock side we added two new positions in $LNKD and $URI. $SCTY and $TUMI reported earnings after the close and as of 8pm, $SCTY was down 9% and $TUMI down 13%. Be prepared to sell these stocks if they open below the protective sell stop.
We have one new setup on our watchlist today in $LNKD, where we plan to add to our exisiting position over Tuesday’s high with a tight stop on the shares we are adding only.
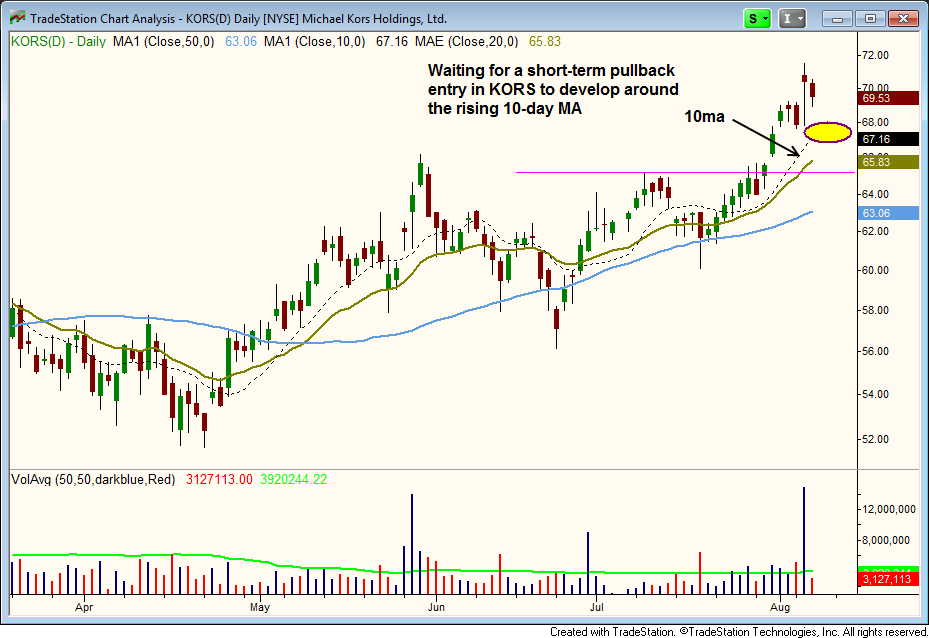
We are monitoring $KORS for a low risk entry point on a pullback (if one develops). Ideally, we would like to see a 2-3 day selloff that undercuts the rising 10-day MA and $68.

Note: You can download the RS+EPS Combo list by logging into the members section of our website.