market timing model: Buy
Current signal generated on close of September 9.Portfolio exposure can be anywhere from 25% to 100% long depending on how individual setups are holding up. If you find yourself with 100% exposure and most positions are not up much, you may wanna chop your size down by a third or more. Remember to add more positions, some of your existing positions must be doing well.Past signals:
- Neutral signal generated on close of August 15
- Buy signal generated on close of July 11
- Neutral signal generated on close of July 5
- Sell signal generated on close of June 24
today’s watchlist (potential trade entries):

Having trouble seeing the open positions graphic above? Click here to view it directly on your web browser instead.
open positions:
Below is an overview of all open positions, as well as a report on all positions that were closed only since the previous day’s newsletter. Changes to open positions since the previous report are listed in pink shaded cells below. Be sure to read the Wagner Daily subscriber guide for important, automatic rules on trade entries and exits.

Having trouble seeing the open positions graphic above? Click here to view it directly on your web browser instead.
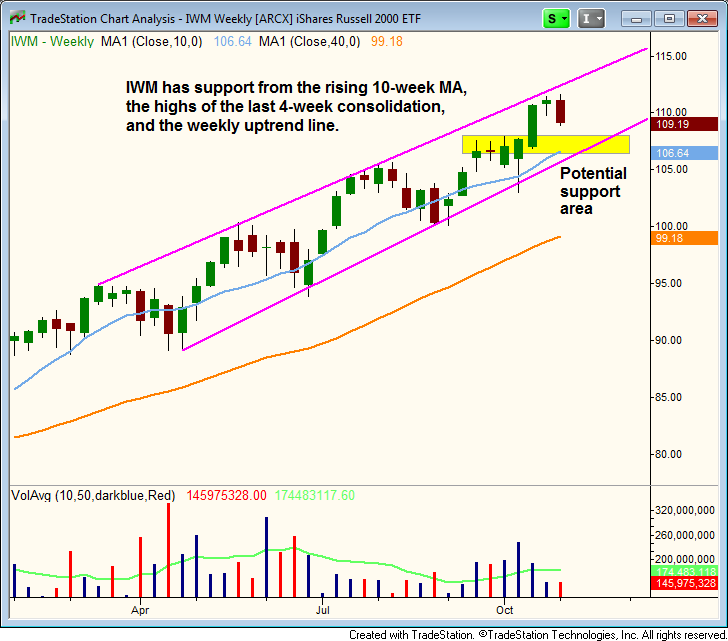
closed positions:
Having trouble seeing the closed positions graphic above? Click here to view it directly on your web browser instead.
ETF position notes:
- No trades were made. We canceled the $GDX buy setup due to Thursday’s action undercutting the prior day’s reversal bar low.
stock position notes:
- Per yesterday’s commentary, we sold $YELP and $BLOX on Thursday’s open for a 30% and 9% gain respectively.
ETF, stock, and broad market commentary:
After pushing higher most of the day, stocks sold off sharply in the final hour of trading. The late selloff forced the broad based averages back into negative territory by the close.
The percent losses on the day were limited to -0.5% or less across the board, but turnover increased on both exchanges (NYSE and NASDAQ), producing a bearish distribution day in the S&P 500, NASDAQ Composite, and Dow.
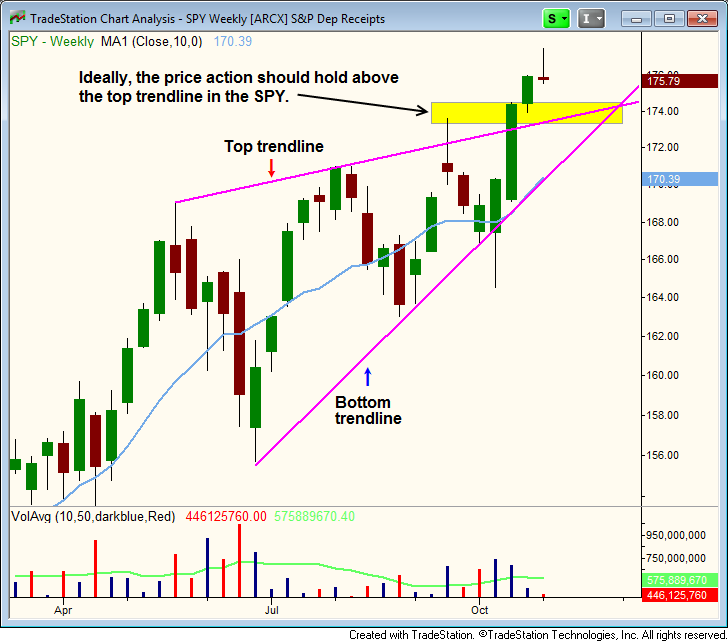
Taking a step back and looking at the weekly support/resistance levels of the Russell 2000 ETF ($IWM), we see a cluster of support around $106 – $108.
The weekly channel below is still dictating the price action, so a pullback to that bottom trendline is certainly a possibility. There is also support from the 10-week MA, and the highs of the short, four-week consolidation.
To be clear, we are not saying that $IWM will pull back to the aforementioned support level. Some corrections are shallow, correcting more by time (sideways) than price, which would allow the rising 10-week MA to catch up.
The weekly chart below shows the recent breakout of an ascending triangle type pattern in the S&P 500 ETF ($SPY).
The top trendline should now serve as support on a pullback, if the momentum from the last breakout is to hold. If the price action is unable to hold the trendline, then we could possibly see a test of the rising 10-week MA and bottom trendline.
Recent breakouts in current long positions $IYZ, $PPA, and $PHO remain in good shape. Our long position in $XRT remains above the 10-day MA and the breakout pivot level at $83. $EWJ is still range bound, but the current consolidation is bullish, so the price action may need a bit more time to move out.
On the stock side, we sold $YELP on the open to lock in a +30% gain. We also sold $BLOX for a 9% gain. We will continue to monitor both setups for potential re-entry points.
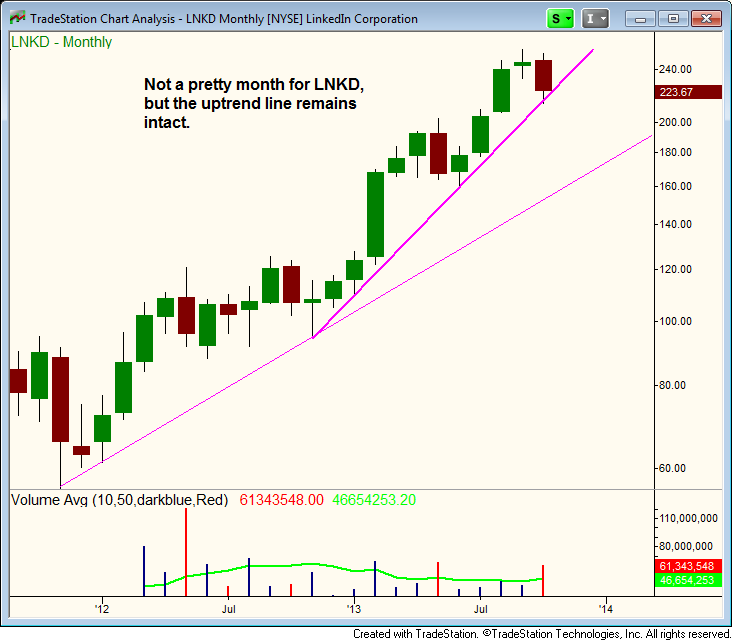
Current long positions in $KORS, $MELI, and $URI remain in good shape. $LNKD, has had a rough week, but is still hanging in there.
The monthly uptrend line in $LNKD is still intact. All we can do now is stick to our stop and see what happens next.
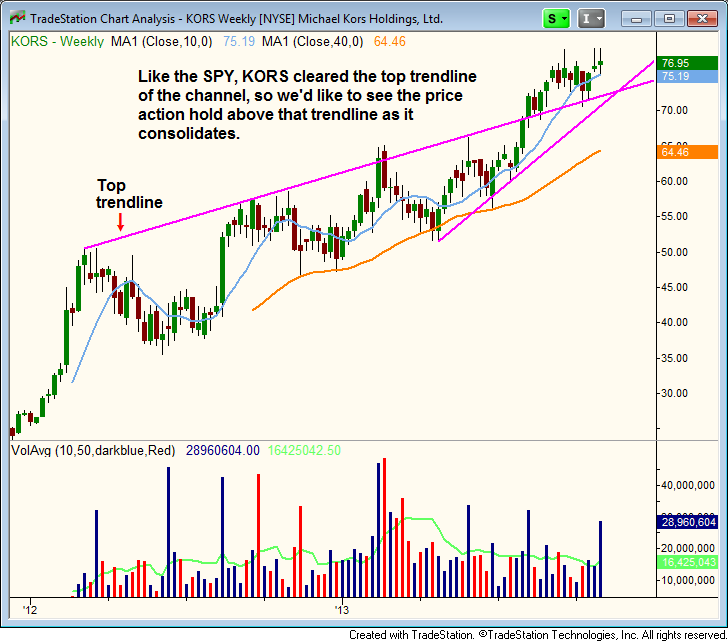
$KORS remains above the 10-week MA, after breaking above the top trendline a few months ago.
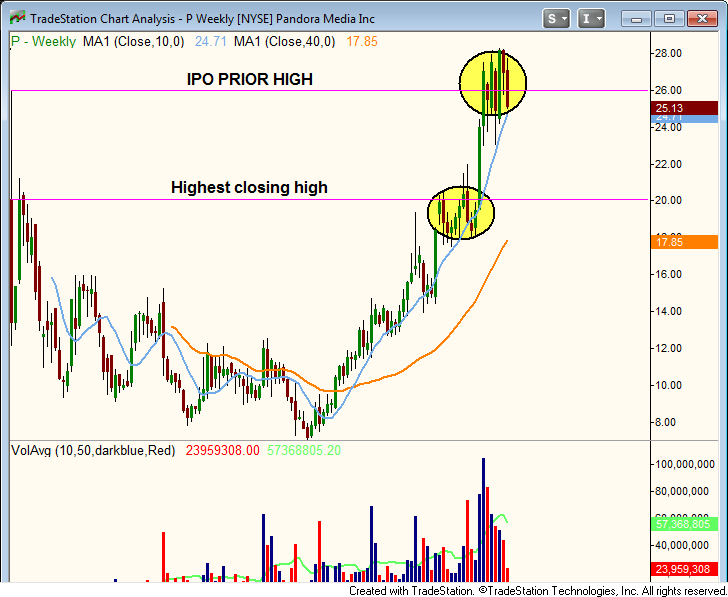
$P remains a potential buy setup if it can gap higher after earnings, or at the very least hold the 10-week MA after the report.
Note that $P cleared the highest closing high on the last breakout a few months ago. The recent consolidation is right at the all-time high price when $P went IPO last summer.
If $P can breakout above current range high, then it will set a new all-time high, with no overhead resistance in its way (just blue skies above).
New buy setups should emerge as the market pulls back in. However, patience is key right now, as we wait for low risk entry points to develop.