market timing model: BUY
Current signal generated on close of November 13.
Portfolio exposure can be anywhere from 50 to 100% long. If positions are holding up well, then one can add exposure beyond 100%.
Past signals:
- Neutral signal generated on close of November 6.
- Buy signal generated on close of September 9
- Neutral signal generated on close of August 15
- Buy signal generated on close of July 11
- Neutral signal generated on close of July 5
- Sell signal generated on close of June 24
today’s watchlist (potential trade entries):

Having trouble seeing the open positions graphic above? Click here to view it directly on your web browser instead.
open positions:
Below is an overview of all open positions, as well as a report on all positions that were closed only since the previous day’s newsletter. Changes to open positions since the previous report are listed in pink shaded cells below. Be sure to read the Wagner Daily subscriber guide for important, automatic rules on trade entries and exits.

Having trouble seeing the open positions graphic above? Click here to view it directly on your web browser instead.
closed positions:

Having trouble seeing the closed positions graphic above? Click here to view it directly on your web browser instead.
ETF position notes:
- No trades were made. Note that we are closing PSP on the open for a small gain if we add the 62 cent dividend.
stock position notes:
- No trades were made. Note the new stops above
ETF, stock, and broad market commentary:
Holiday Schedule
- Wednesday Jan. 1 – Stock market is closed. Wagner Daily will not be published on Tuesday night. Look for Thursday’s report to be sent out Wednesday night.
- Wednesday Jan. 1 webinar is canceled.
HAPPY NEW YEAR!
The major averages closed in mixed territory, but gains and losses were limited to the -0.2% to +0.2% range, so not a whole lot going on. There was some action in the NASDAQ Composite early, as the price undercut a three-day low before reversing to close in the top third of the day’s range.
Kandi Technologies Group ($KNDI), which is a long position in our stock portfolio has exploded higher the past two days, and is now up over 60% from our entry on December 6 at 7.10. Note the new stop price in the open positions section above.
Global X Social Media Index ETF ($SOCL), which is a long position in the ETF portfolio has pulled back to support of the rising 10-day MA. We look for the price action to find support in the 20.50 to 20.80 area over the next few days.
PowerShares Golden Dragon China Portfolio ETF ($PGJ), triggered a buy entry in our ETF portfolio on December 23 when it cleared the downtrend line drawn on the chart below.
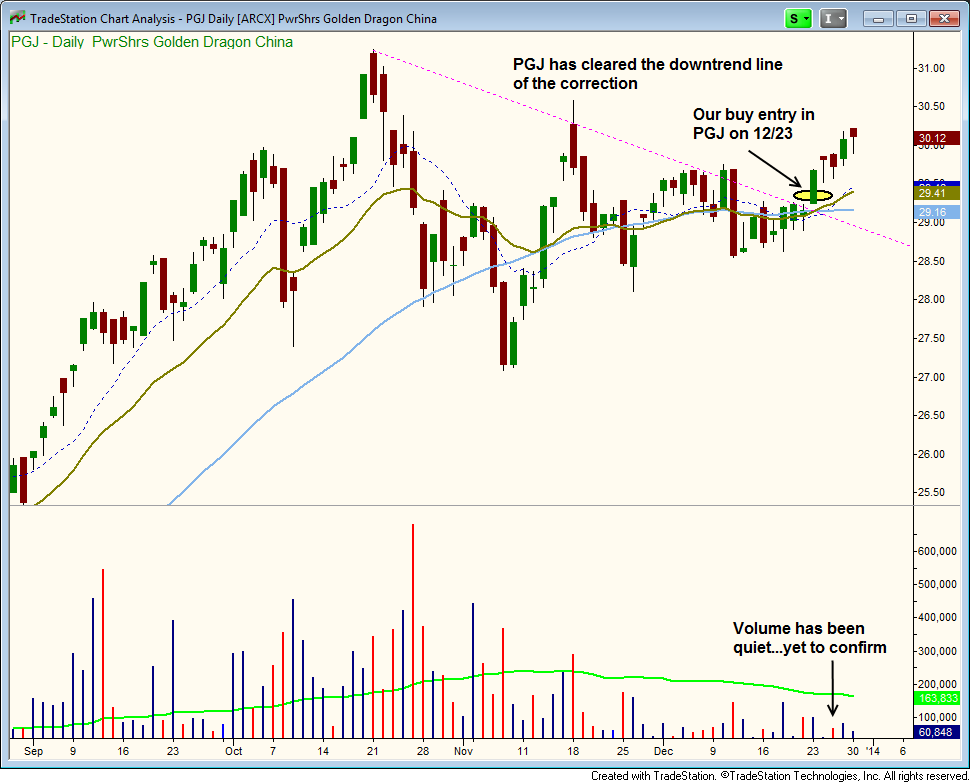
The volume in $PGJ has been quiet on the move out, so we would expect some sort of pause prior to breaking out to new highs.
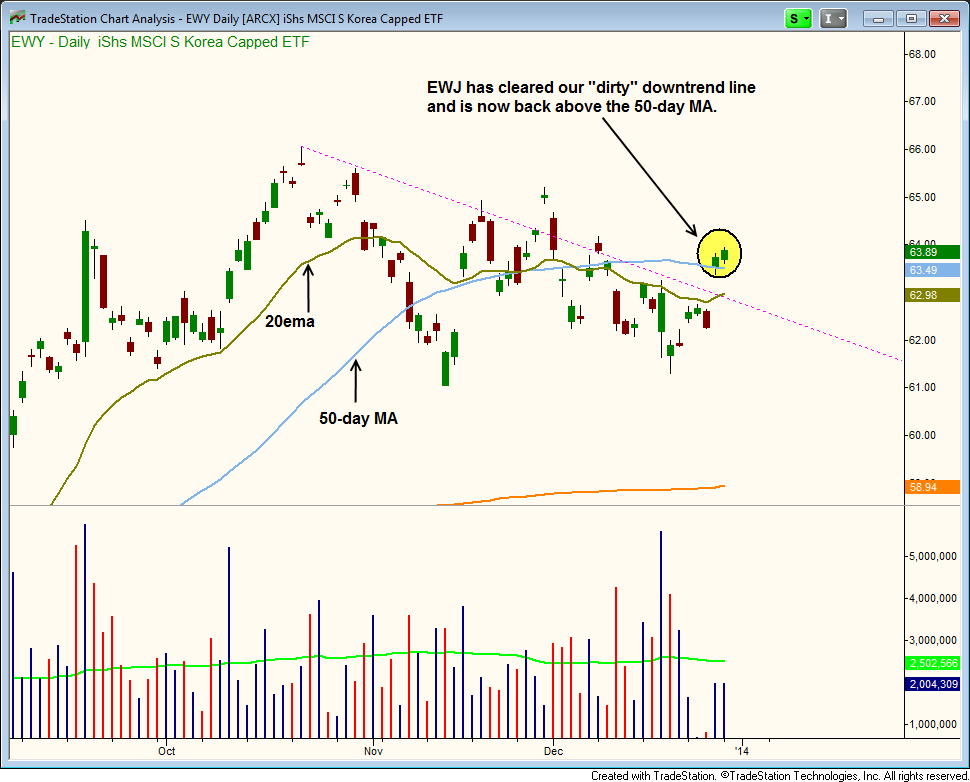
iShares MSCI South Korea ETF ($EWY) recently cleared the “dirty” downtrend line and has closed above the 50-day MA the past two sessions. We call it a dirty downtrend line because it may not be drawn by the book, but we prefer to use what makes sense.
On the chart below, the trendline provided resistance on several touches except for one, which was a one day close above the trendline on 11/29.
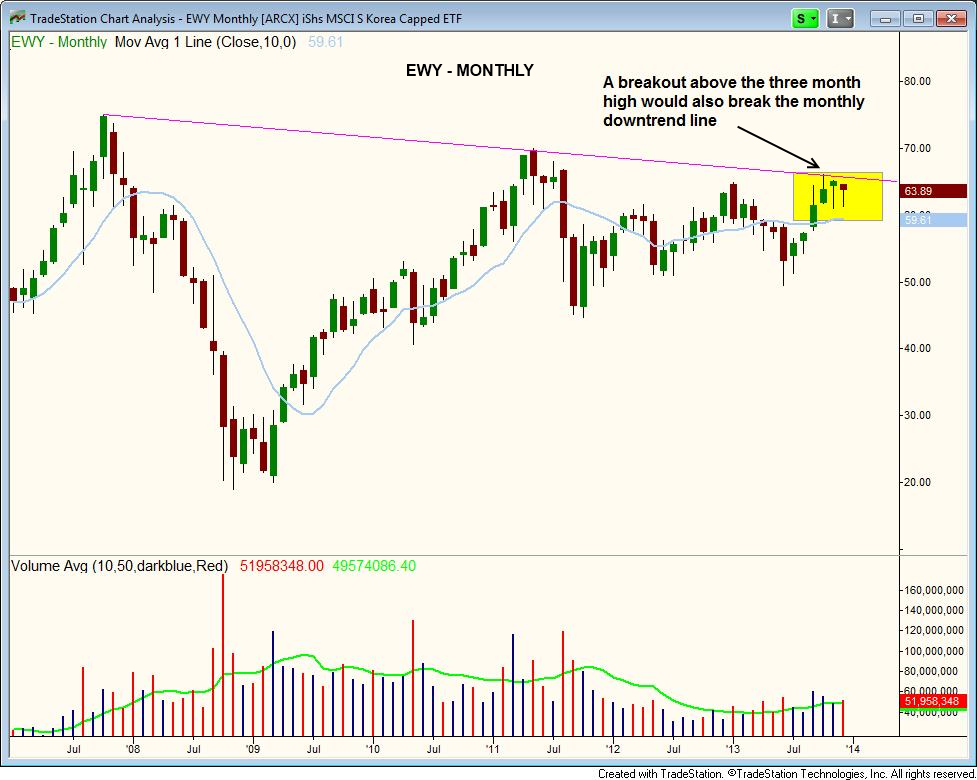
As always, it is important to look at multiple time frames when analyzing a potential trade. With $EWY, the monthly chart below shows that a breakout above the October 2013 high would coincide with a break of the monthly downtrend line. If $EWY can clear the $65 level, then we could see a rally to the highs of 2008 around $75.
We are placing $EWY on today’s watchlist. Please see above for trade details.
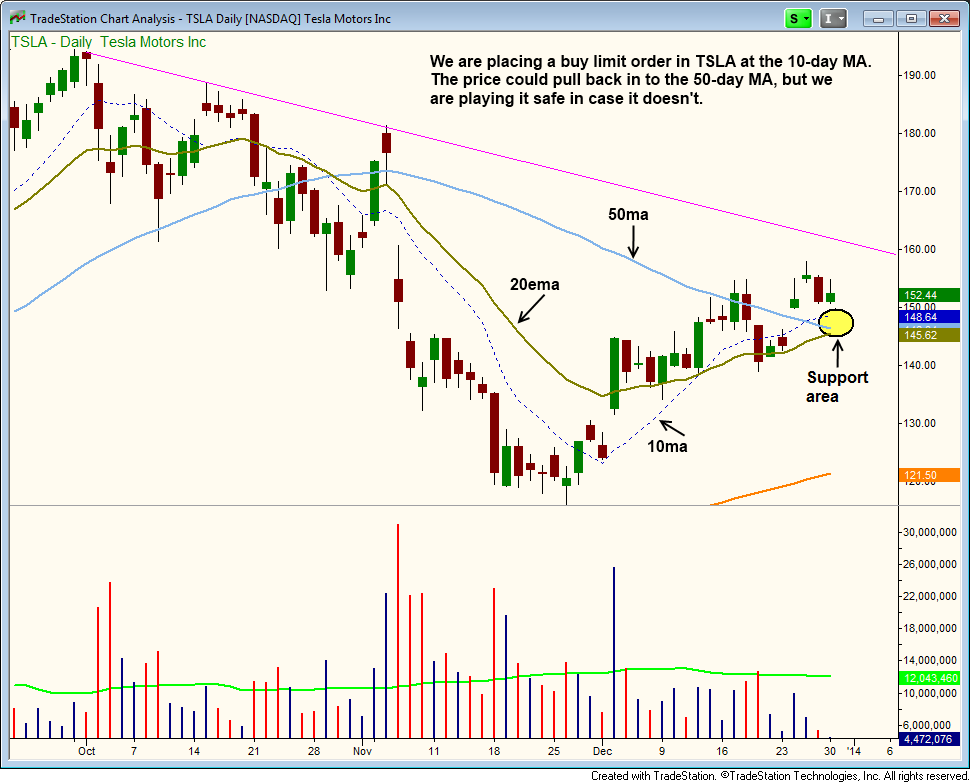
On the stock side we have one new setup in $TSLA, which is A rated.
After rallying off the 200-day MA in December, $TSLA has held support from the rising 20-day EMA, and is now back above the 50-day MA. We are looking for a slight pullback to enter on weakness. We have a buy limit order placed at the 10-day MA. We could see a deeper retracement to the 50-day MA (or slightly lower), but we prefer to play it safe and use the 10-day MA as our entry.
The stop is placed 10% away, which is typically our max stop when trading institutional quality stocks. The idea here is that the price action should hold up around the 50-day MA.
The 5-minute rule will not apply to the entry because it is a buy limit order (5-minute rule applies to buy stops only).