market timing model:
Buy – Signal generated on the close of August 16 (click here for more details)
today’s watchlist (potential trade entries):

Having trouble seeing the open positions graphic above? Click here to view it directly on your web browser instead.
open positions:
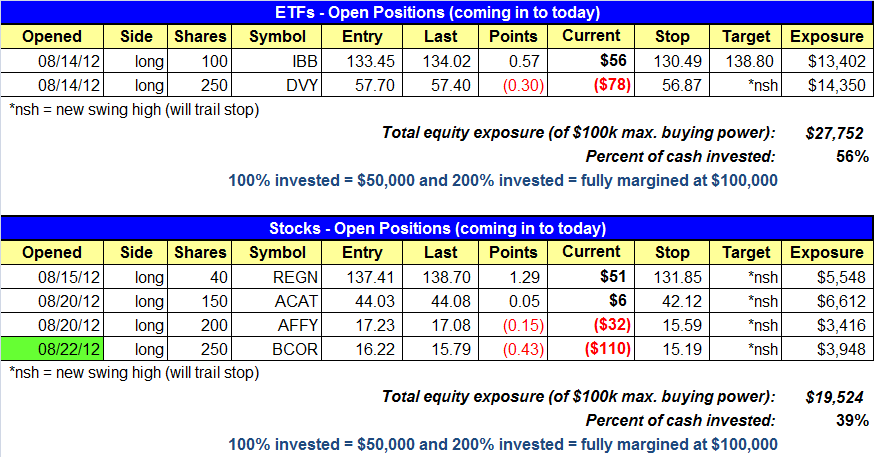
Below is an overview of all open positions, as well as a report on all positions that were closed only since the previous day’s newsletter. Net P/L figures are based on two separate $50,000 model portfolios (one for ETFs and one for stocks). Changes to open positions since the previous report are listed in pink shaded cells below. Be sure to read the Wagner Daily subscriber guide for important, automatic rules on trade entries and exits.

Having trouble seeing the open positions graphic above? Click here to view it directly on your web browser instead.
closed positions:

Having trouble seeing the closed positions graphic above? Click here to view it directly on your web browser instead.
ETF position notes:
- EWW stop triggered. EWW formed a bullish reversal bar yesterday so we are officially re-entering the position above yesterday’s high. Re-entering the position is the right thing to do when the setup is still valid.
stock position notes:
- Sold EQIX for a + $170 gain.
- BCOR buy stop triggered. Note the change to the stop price in REGN on the watchlist.
ETF and broad market commentary:
Following through on momentum of the previous day’s decline, stocks trended lower throughout the first half of yesterday’s session. However, the bulls returned in the afternoon, enabling the S&P 500 and Nasdaq Composite to close near their intraday highs. The rest of the main stock market indexes showed a bit of relative weakness, causing mixed results in the broad market. The Nasdaq ($COMPQ) ticked 0.2% higher, the S&P 500 ($SPX) was unchanged, and the Dow Jones Industrial Average ($DJIA) slipped 0.2%. The S&P MidCap 400 ($MID) and small-cap Russell 2000 indices declined 0.2% and 0.3% respectively.
Total volume in both the NYSE and Nasdaq was 7% lighter than the previous day’s levels. Across the board, declining volume marginally exceeded advancing volume. Given the combination of mixed closing prices of the major indices and decreased turnover, yesterday’s market internals lacked any type of significant signal.
The iShares Nasdaq Biotech ETF ($IBB), which we have been long in our model trading portfolio since August 14, showed relative strength by rallying 0.9% yesterday. More importantly, it closed just above an area of near-term price resistance. In case you missed our original August 14 buy entry, the chart pattern of $IBB shows the ETF is now presenting a secondary buy setup (or a point to add additional shares). The first chart below is of the hourly timeframe, which shows yesterday’s breakout above the near-term horizontal price resistance:

Shifting to the daily timeframe, notice that yesterday’s rally in IBB also correlated to a breakout above the downtrend line from the high of July 27. This further increases the odds of IBB moving higher from here. If looking for a secondary entry point in IBB, one might consider a buy trigger above yesterday’s high of $134.32, which would help to confirm yesterdays rally above resistance:

In some market environments, particularly those with a flat or indecisive trend, ETFs are a great instrument to trade because one can choose from commodity, currency, fixed income, or any other type of ETF with a low correlation to the direction of stock prices. But in uptrending markets, trading leading individual stocks can result in substantially more profit than trading ETFs. This is the main reason why we trade both ETFs and individual stocks in the model portfolio of this Wagner Daily newsletter. Over the years, we have found the combination of trading both ETFs and stocks held to smooth out the equity curve of one’s trading account.
Presently, most ETFs are moving in lockstep with the direction of the broad market, as leading individual stocks outperform. As such, there have been more daily trade setups for stocks than ETFs lately. But markets are constantly changing and very dynamic. As such, we will continue scanning for the best ETF setups every night. $IBB is still showing up near the top of the list for the Potential Breakout scan of the MTG Stock Screener).
stock commentary:
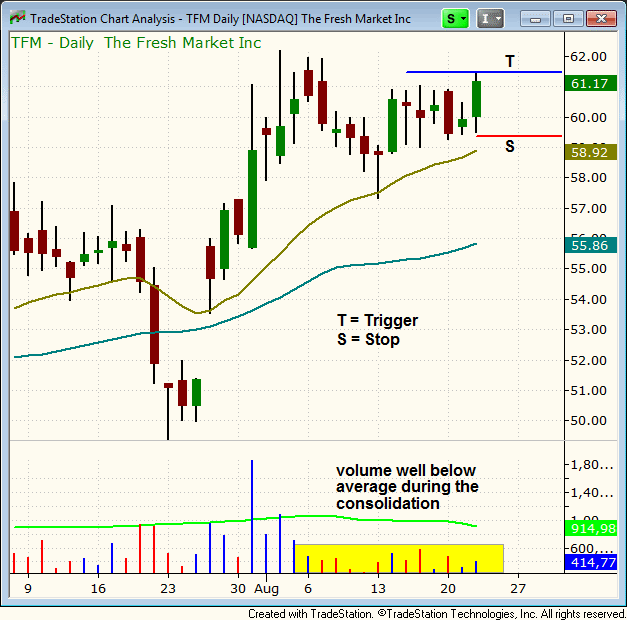
Although $TFM is scheduled to report earnings next Wednesday, we are taking a shot at a buy entry in hopes of catching a quick pop ahead of earnings. We placed a tight stop placed just below the 20-period EMA on the hourly chart in case the price action fails to follow through right away. We call this a “GONG” setup (Go Or No Go), which basically means that we want to be right or right out.

Due to a brokerage downgrade, EQIX gapped significantly lower and triggered our stop on the open. However, we did manage a small $170 profit. As I mentioned yesterday, we normally do not trail stops so soon after a breakout; however, we are managing positions conservatively until conditions improve. The fact that it was downgraded just after we raised the stop was simply bad luck. This is just part of doing business as a trader and there isn’t much we can do about it…just book the gain and move on.
If you are a new subscriber, please e-mail [email protected] with any questions regarding our trading strategy, money management, or how to make the most out of this report.
relative strength combo watchlist:
Our Relative Strength Combo Watchlist makes it easy for subscribers to import data into their own scanning software, such as Tradestation, Interactive Brokers, and TC2000. This list is comprised of the strongest stocks (technically and fundamentally) in the market over the past six to 12 months. The scan is updated every Sunday, and this week’s RS Combo Watchlist can be downloaded by logging in to the Members Area of our web site.