ETFs and market commentary:
Stocks were set to post modest gains yesterday before a wave of late day selling resulted in a negative day on Wall Street. All five major indices closed lower as trade quickened. Monday’s big winner, the small-cap Russell 2000, took the most punishment yesterday, as it closed lower by 0.7%. The S&P MidCap 400 slid 0.4%, while both the Dow Jones Industrial Average and S&P 500 fell 0.3%. The Nasdaq churned to close at the breakeven mark. Home construction, brewers and computer hardware showed the most resiliency yesterday, while oil services, precious metals and financial services fell more than 1.5%.
Market internals ended the day mixed. Turnover rose on the Nasdaq by 3.5% but closed 1.5% lower on the NYSE. Still, declining volume was higher across the board. Declining volume outpaced advancing volume by a factor of 2.5 to 1 on the NYSE and 1.3 to 1 on the Nasdaq. The NYSE narrowly escaped a distribution day due its lighter trade. Even though the Nasdaq closed at the breakeven mark, the higher volume suggests churning, a market condition where higher volume results in no movement in price during an established trend. Consequently, we consider Tuesday a distribution day on the Nasdaq.
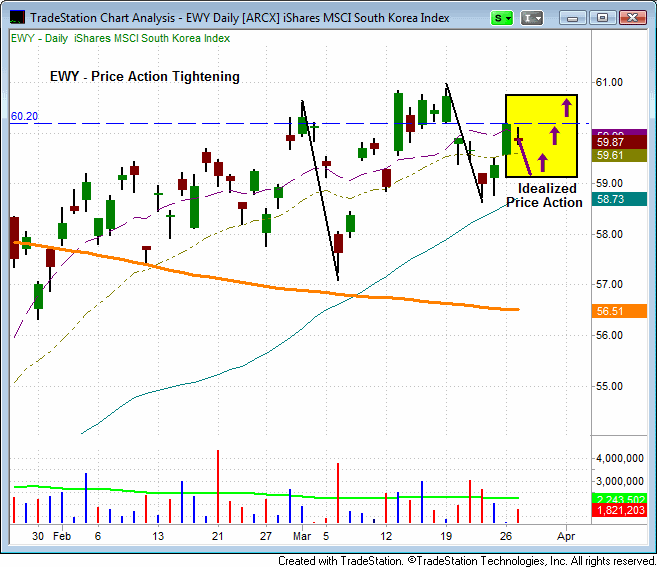
Over the past three weeks, the iShares MSCI South Korea Index (EWY) has been setting a sequence of higher lows, as it has tested support near its 50-day MA on two occasions. EWY could provide a long entry on a move above the two day high of $60.20. An ideal setup for EWY would involve this ETF setting a higher low by undercutting its 20-day EMA and then reversing through the $60.20 mark (see purple arrows). We will be monitoring EWY closely for a possible long entry.

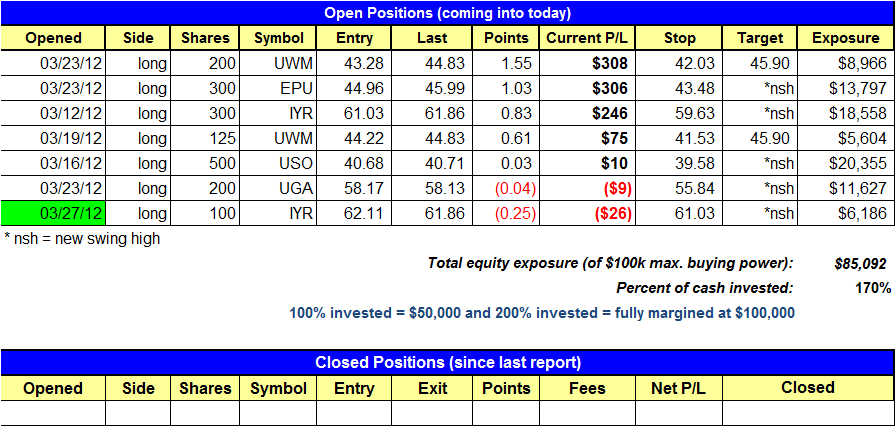
Yesterday, via an intraday alert, we added 100 shares to our open position in IYR. Despite the late selling pressure, all of our positions held up relatively well. EPU showed impressive strength as it closed at session highs. Although yesterday’s close was not comforting, the markets avoided wholesale distribution. As long as we avoid a clustering of distribution days, there’s little reason to question the legitimacy of the current bull market.
Today’s ETF Watchlist:

Daily Performance Report:
Below is an overview of all open positions, as well as a performance report on all positions that were closed only since the previous day’s newsletter. Net P/L figures are based on the $50,000 Wagner Daily model account size. Changes to open positions since the previous report are listed in red text below. Please review the Wagner DailySubscriber Guide for important, automatic rules on trigger and stop prices

Having trouble seeing the position summary graphic above? Click here to view it directly on your Internet browser instead.
Notes:
- Added 100 shares to our position in IYR.
- Reminder to subscribers – Intraday Trade Alerts to your e-mail and/or mobile phone are normally only sent to indicate a CHANGE to the pre-market plan that is detailed in each morning’s Wagner Daily. We sometimes send a courtesy alert just to confirm action that was already detailed in the pre-market newsletter, but this is not always the case. If no alert is received to the contrary, one should always assume we’re honoring all stops and trigger prices listed in each morning’s Wagner Daily. But whenever CHANGES to the pre-market stops or trigger prices are necessary, alerts are sent on an AS-NEEDED basis. Just a reminder of the purpose of Intraday Trade Alerts.
- For those of you whose ISPs occasionally deliver your e-mail with a delay, make sure you’re signed up to receive our free text message alerts sent to your mobile phone. This provides a great way to have redundancy on all Intraday Trade Alerts. Send your request to [email protected] if not already set up for this value-added feature we provide to subscribers.
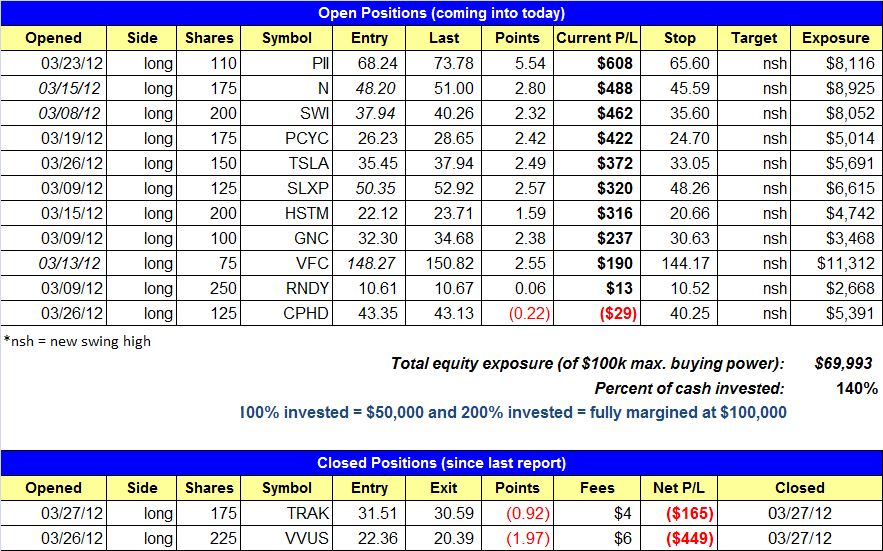
Our open positions remain in good shape with eight of the eleven positions showing a gain of 5% or more. VVUS triggered its stop but rebounded late in the day, so we will be monitoring the action for a potential re-entry point. The TRAK breakout entry triggered, but there was no follow through and the price action sold off sharply. We made a judgement call to exit 100 shares around 3:45 pm and the remaining 75 shares at 3:50 pm. We felt it was better to book a small loss than to hold the position overnight due to the ugly selling action in the final hour of trading.
Our scans did not turn up many actionable plays so there are no setups on the watchlist today. If any action is taken during the day we will send an intraday alert.
For those of you who are new subscribers please contact me at [email protected] if you have any questions regarding strategy, money management, or how to make the most out of this report.
Today’s Stock Watchlist:

Daily Performance Report:
Below is an overview of all open positions, as well as a performance report on all positions that were closed only since the previous day’s newsletter. Net P/L figures are based on the $50,000 model account size. Changes to open positions since the previous report are listed in red text below.
Having trouble seeing the position summary graphic above? Click here to view it directly on your Internet browser instead.
Notes:
- Per intraday alert, sold TRAK for a small loss due to the false breakout action. VVUS hit the sell stop and we closed the trade.
Relative Strength Watchlist:
The Relative Strength (or RS) Watchlist makes it easy for subscribers to import data into their own scanning software, such as Tradestation, Interactive Brokers, and TC2000. The list is comprised of the strongest 100 (or so) stocks in the market over the past six to 12 months. The scan is based on the following criteria and is updated every Monday:
- Stock is in a well defined uptrend, trading above both the 50-day and 200-day moving averages, with the 50-day moving average above the 200-day moving average (both moving averages should be in an uptrend as well).
- Today’s close is less than 20% off the 52-week high
- Close is greater than $5.
- Volume is greater than 200,000 shares per day (using a 50-day volume moving average).
Click here to view this week’s Relative Strength Watchlist in excel
Click here to view this week’s Relative Strength Watchlist as a text file
