Commentary:
Broad market averages were unable to build on Wednesday’s momentum, as a quick probe above the prior day’s high in the morning session failed to attract much buying interest. After a few hours of choppy action, stocks sold off to new intraday lows in the final hour of trading, with most averages closing near the lows of the day. The small-cap Russell 2000 and S&P Midcap 400 indices both fell 0.9%. The S&P 500, Dow Jones Industrial Average, and Nasdaq Composite dropped 1.0%, 1.2%, and 1.3% respectively.
Total volume was mixed yesterday. NYSE volume finished 7% off Wednesday’s pace, while Nasdaq turnover edged 1% higher. Once again total volume came in below its 50-day moving average on both exchanges, which suggests that the institutions have also been in S.O.H. (sit on hands) mode during the bounce off the lows. As we mentioned yesterday, the averages can still push higher on light volume, but the odds of a sustainable rally are quite low without a few heavy volume accumulation days in place.
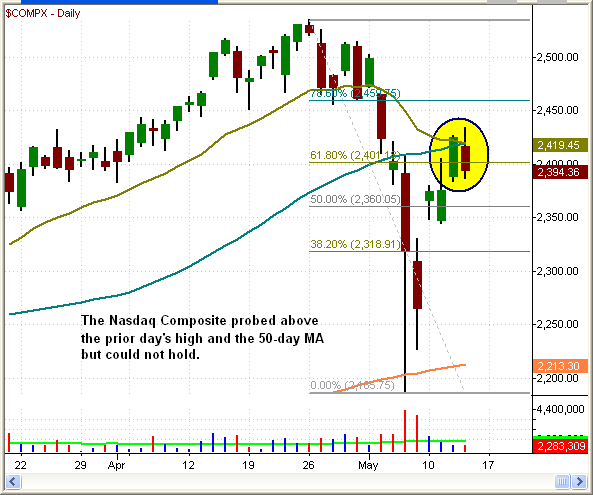
Resistance from the 61.8% Fibo level, the downward sloping 20-day EMA, and the 50-day MA (all around the 2,4000 – 2,425 area) has put some pressure on the Nasdaq Composite. We may see another probe above the 50-day MA if there is no follow through to the downside over the next few days.
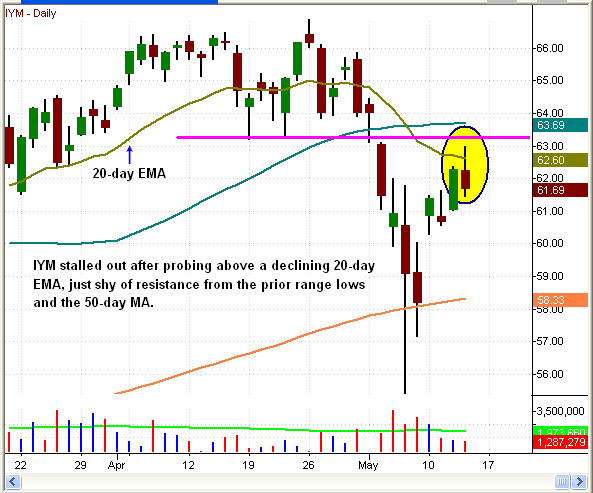
Our existing short position in the iShares Basic Materials Index (IYM) received a little help from the downward sloping 20-day EMA yesterday, as the action reversed nicely after probing above the moving average to close near the lows of the day. We like the bearish price and volume patterns that have emerged over the past two weeks, as the heavy volume selloff is followed by a bounce on declining volume.
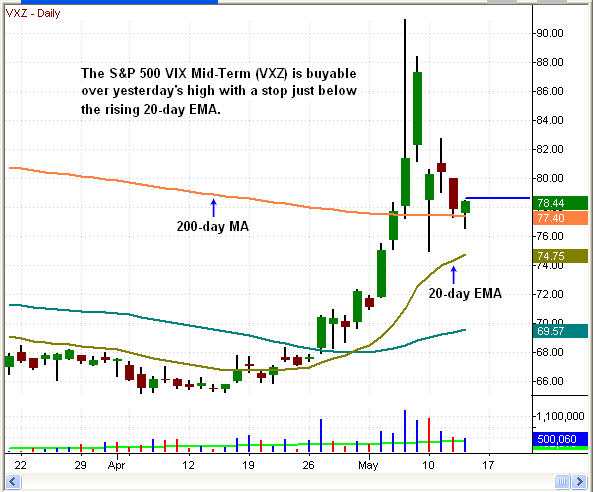
Another way to capitalize on further broad market weakness is by playing the CBOE Volatility Index ($VIX) through the iPath S&P 500 VIX Mid-Term Futures ETF (VXZ). Since VXZ tracks the mid-term months of the S&P 500 VIX futures contract, its performance is better than the VXX, which is focused on the near months. After exploding above the 50-day and 200-day MA’s in late April/early May, the price action has settled down and found support at the 200-day MA, and is buyable over yesterday’s high.
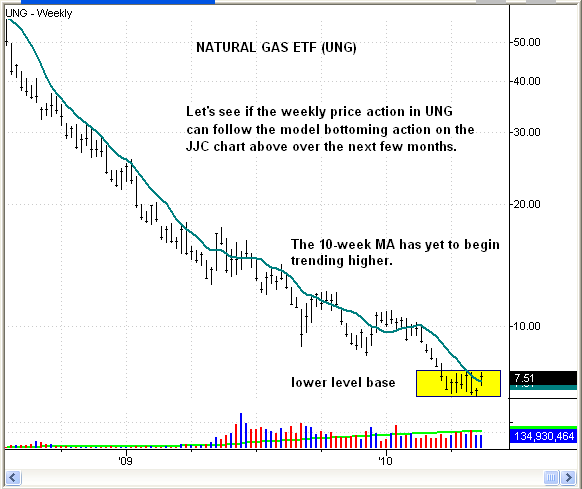
In yesterday’s report we mentioned that the Natural Gas Fund (UNG) is a potential trend reversal candidate above the 50-day moving average for aggressive traders. We also mentioned that a more conservative entry would be to wait for the first pullback to the 50-day moving average after a range breakout. We have a few charts of successful trend reversals below to give us some perspective on a pullback entry off the 50-day MA (we used bar charts so that we could squeeze in more price action).
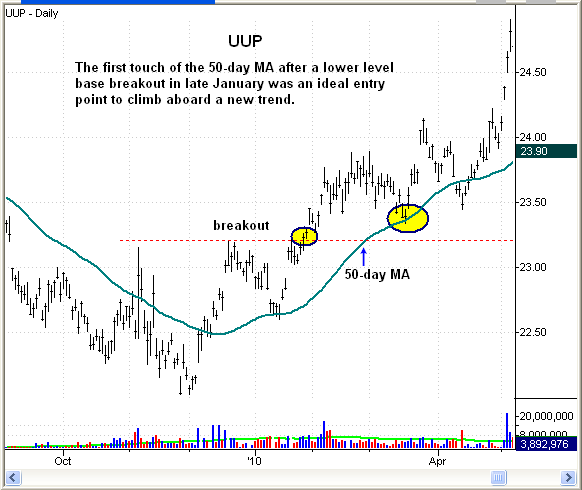
UUP bottomed out from October through January before reversing its downtrend. We clearly see that with a little time and patience there is a low-risk buy entry on the first pullback to the 50-day MA.
The same bottoming action played out in JJC at the beginning of 2009. First we see a lower level base breakout that is followed by an upward sloping 50-day MA. Once a strong uptrend is in place, the first touch of the 50-day MA is once again an ideal low-risk entry point.

The weekly chart below shows how the setup develops on a larger timeframe. Note how the base breakout is followed by a rising 10-week MA. Once the uptrend is in place, the first pullback to the 10-week MA (or 50-day MA on the daily chart) is an ideal buy point.
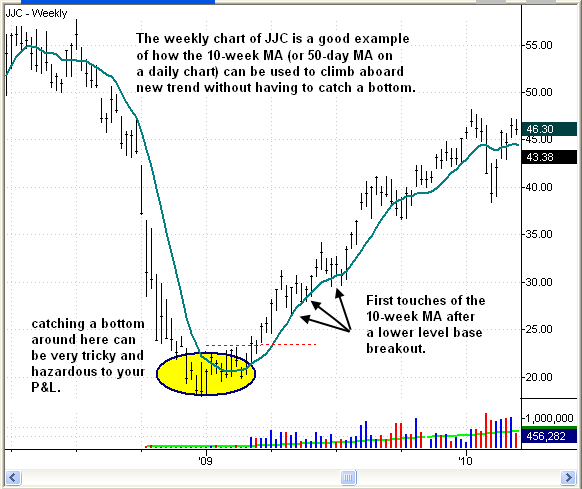
Aggressive traders with strict discipline can buy a lower level breakout in a potential trend reversal like UNG. These type of setups can fall apart quickly until a new uptrend is established, so proper risk management plays a pivotal role. Those traders who have trouble sticking to stops or find that they freeze up when the action reverses should consider using the 50-day MA as an easy entry point. Let’s see if the action in UNG over the next few months follows the models of UUP or JJC.
Today’s Watchlist:
There are no new setups in the pre-market today, though we are monitoring VZX for a potential buy entry depending on the opening price action. We still want to remain cautious on the long side, as we have yet to see any significant accumulation days during this rally. If any new trades are entered, we will promptly send an Intraday Trade Alert with details.
Daily Performance Report:
Below is an overview of all open positions, as well as a performance report on all positions that were closed only since the previous day’s newsletter. Net P/L figures are based on the $50,000 Wagner Daily model account size. Changes to open positions since the previous report are listed in red text below. Please review the Wagner Daily Subscriber Guide for important, automatic rules on trigger and stop prices.
- Per intraday alert, our VXZ buy entry did not trigger yesterday. We are cancelling the setup for now, but will send an intraday alert if any action is taken.
- Reminder to subscribers – Intraday Trade Alerts to your e-mail and/or mobile phone are normally only sent to indicate a CHANGE to the pre-market plan that is detailed in each morning’s Wagner Daily. We sometimes send a courtesy alert just to confirm action that was already detailed in the pre-market newsletter, but this is not always the case. If no alert is received to the contrary, one should always assume we’re honoring all stops and trigger prices listed in each morning’s Wagner Daily. But whenever CHANGES to the pre-market stops or trigger prices are necessary, alerts are sent on an AS-NEEDED basis. Just a reminder of the purpose of Intraday Trade Alerts.
- For those of you whose ISPs occasionally deliver your e-mail with a delay, make sure you’re signed up to receive our free text message alerts sent to your mobile phone. This provides a great way to have redundancy on all Intraday Trade Alerts. Send your request to [email protected] if not already set up for this value-added feature we provide to subscribers.

Having trouble seeing the position summary graphic above?
Click here to view it directly on your Internet browser instead.
Notes:
Edited by Deron Wagner,
MTG Founder and
Head Trader