Buy
– Signal generated on the close of April 30
We are now in confirmed buy mode, which means that we can go on margin if needed.
today’s watchlist (potential trade entries):

Having trouble seeing the open positions graphic above? Click here to view it directly on your web browser instead.
open positions:
Below is an overview of all open positions, as well as a report on all positions that were closed only since the previous day’s newsletter. Net P/L figures are based a $100,000 model portfolio. Changes to open positions since the previous report are listed in pink shaded cells below. Be sure to read the Wagner Daily subscriber guide for important, automatic rules on trade entries and exits.

Having trouble seeing the open positions graphic above? Click here to view it directly on your web browser instead.
closed positions:

Having trouble seeing the closed positions graphic above? Click here to view it directly on your web browser instead.
ETF position notes:
- No trades were made.
stock position notes:
- $LNKD sell stop triggered and we are out. $SNSS long entry triggered.
ETF, stock, and broad market commentary:
The market got off to a strong start with a significant gap up on the open, but failed to follow through beyond the first hour and pulled back in the rest of the day. Stocks were able to bounce in the last hour of trading, allowing the averages to close off the lows of the session. The small cap Russell 2000 led the advance with a 1.3% gain, while the S&P 500 was the weakest performer on the day at + 0.6%. Turnover increased on both exchanges, and when combined with yesterday’s price action, it isn’t much of a stretch to label the day as heavy volume stalling (churning). The S&P 500 has bot been able to close above $1,670 in four attempts (3 last week and yesterday), so it looks as though the index is establishing a trading range. Time will tell.
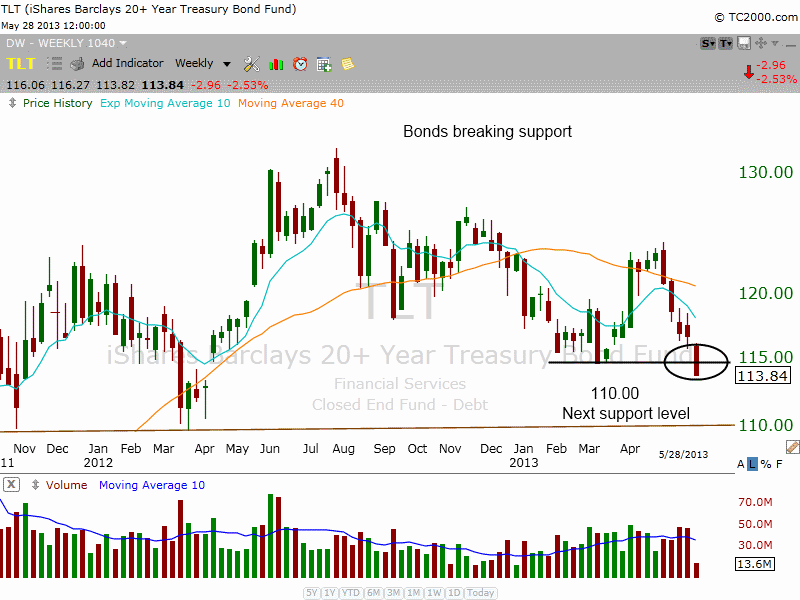
Bonds have been taking a beating the past few weeks, as evidenced by the sharp reversal in $TLT off the highs of April. If $TLT cracks support at $115 – $116 it could be headed for the $110 area. With interest rates climbing, sitting in bonds while the market climbs higher will be a tough pill to swallow for many.
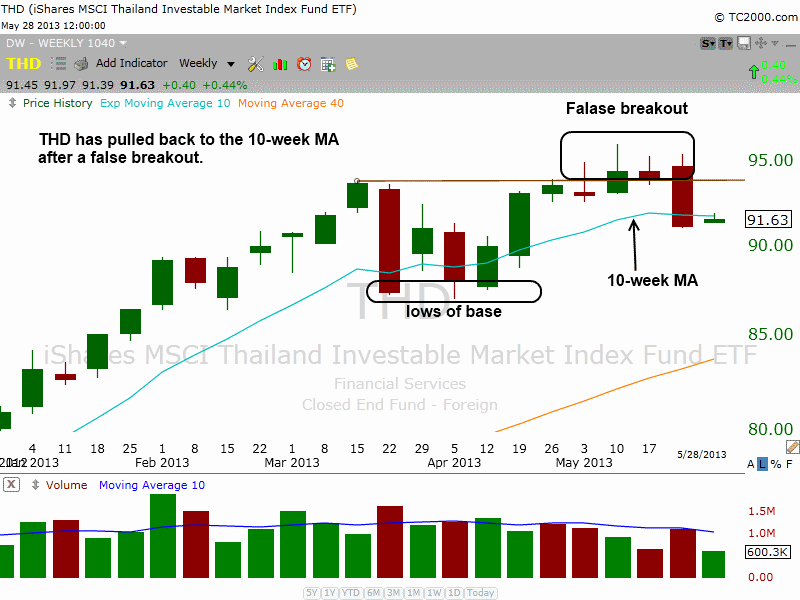
After a false breakout to new highs the past few weeks, iShares MSCI Thailand ($THD) has pulled back to the rising 10-week MA, which is almost the same as the 50-day MA on a daily chart. For the setup to remain bullish in the short-term, the price action should hold at or around the 10-day MA. A pullback to the prior base low would not kill the setup, but the price action at that point would need several more weeks of consolidation before a bullish buy pattern could emerge.
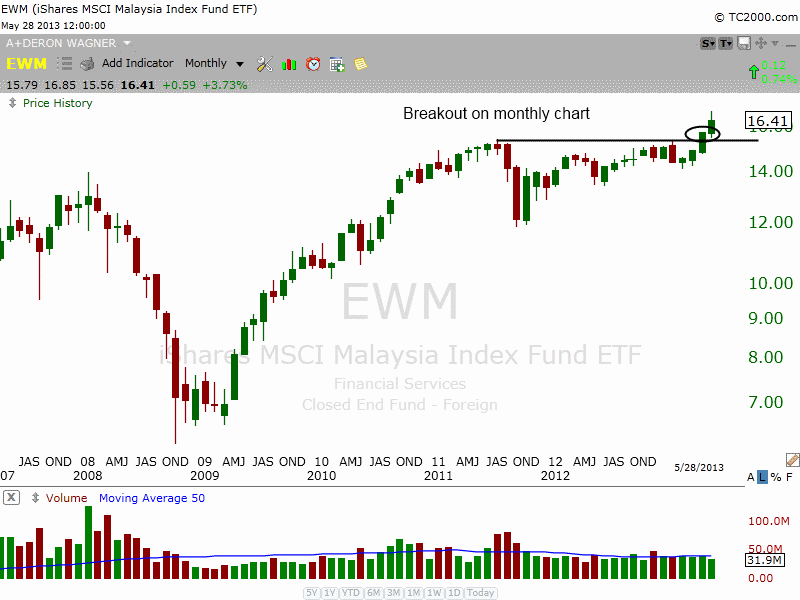
iShares MSCI Malaysia Index ($EWM) broke out to new highs on the monthly chart:
On the daily chart we see the price action has pulled back to the rising 20-day EMA. If the price action holds above the 20-day EMA, we could then see a break of the short-term downtrend line within a few days.
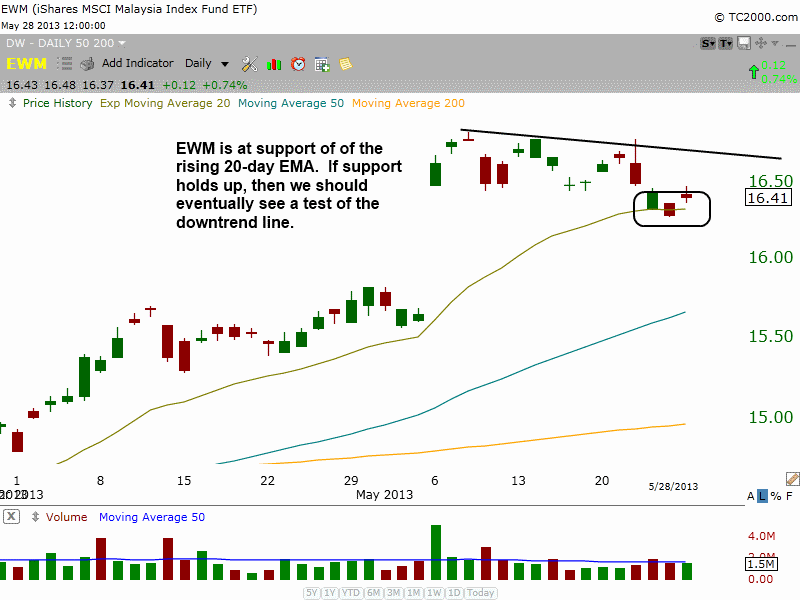
Ideally, one more day up followed by one or two days sideways with a test of the 20-day EMA would produce a low-risk entry point for partial size.
With $SMH and $TAN stalling out yesterday, we are raising the stop to just below Tuesday’s low on partial size (roughly 1/3 of the position). This allows us to reduce our risk if the pullback off support does not lead to new highs.
On the stock side, we have one new position in $SNSS, which sold off along with the market after a strong open. $SNS is still trading above the 10-day MA, so let’s see how it holds up this week.
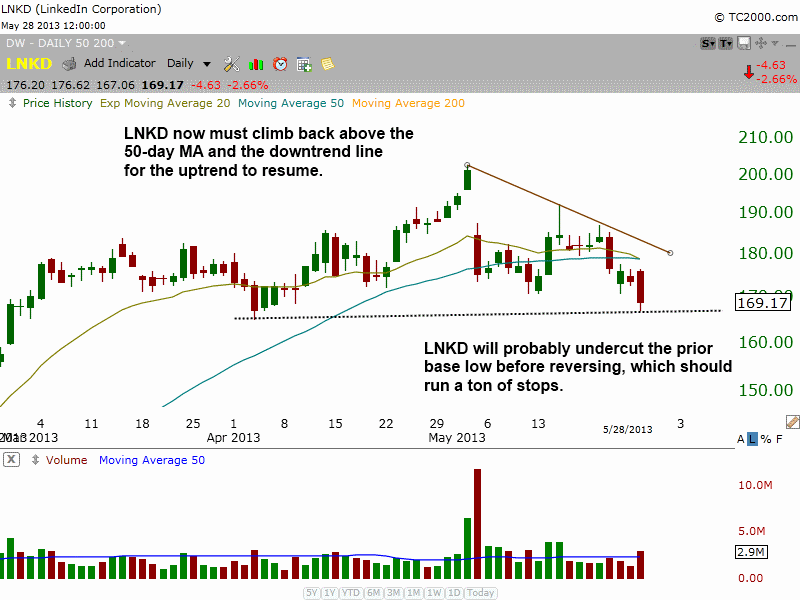
We stopped out of $LNKD yesterday for a smaller than average loss. With $LNKD selling off on higher volume, we could see an undercut of the April low. Since we feel that this is one of the best stocks in the market, we will continue to monitor the action for a low risk entry point. We will probably look for a break of the downtrend line as a buy point for partial size, but the price action would need to tighten up quite a bit before we re-enter.
