Commentary:
Yesterday’s session was a roller coaster ride that equally kept bulls and bears on their toes, but the sellers gained the upper hand by the close. Stocks opened lower, promptly reversed sharply higher, whipped around in a wide range throughout most of the afternoon, then plunged in the final thirty minutes of trading. The Nasdaq Composite gave up an intraday gain of 2.2% to finish just 0.1% higher. The S&P 500 and Dow Jones Industrial Average closed in the red, losing 0.8% and 1.0% respectively. Like the Nasdaq, the small-cap Russell 2000 eked out a gain of 0.1%. The S&P Midcap 400 ticked 0.3% higher. The S&P 500 and Dow Jones Industrials settled near their intraday lows. The Nasdaq closed near the bottom third of the day’s range.
Turnover rose across the board, causing the S&P 500 to register a bearish “distribution day.” Total volume in the NYSE increased 7% above the previous day’s level, while trading in the Nasdaq was 8% higher. It was the second display of institutional selling in the S&P 500 so far this month. In a healthy market, two “distribution days” over the course of several weeks can usually be absorbed. However, another round (or more) of higher volume selling over the next week could trigger a substantial correction off the recent highs. Despite the losses in the S&P and Dow, market internals weren’t that bad. In the NYSE, declining volume exceeded advancing volume by less than 2 to 1. The Nasdaq adv/dec volume ratio was positive by a margin of approximately 3 to 2.
Several times over the past year, we’ve profited from trades in CurrencyShares Japanese Yen ProShares (FXY). This ETF, which tracks the value of the Japanese yen to the U.S. dollar, has been in a long-term uptrend for nearly two years, though there have been two intermediate-term downtrends since then. This is shown on the weekly chart below:

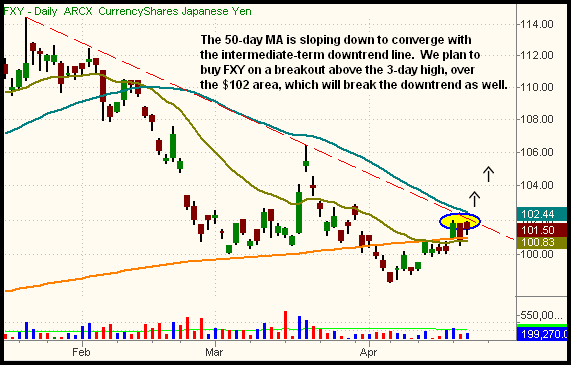
Drilling down to the shorter-term daily chart, we see that FXY is poised to break out above the downtrend line of its latest intermediate-term correction. Take a look:

If FXY rallies above the downtrend line shown above, it easily has the potential to at least recover back to its 52-week high. If it does, a rally to new highs and resumption of the multi-year uptrend is possible as well. Since this is an intermediate-term trade setup, consider reducing share size to enable you to keep a looser stop than usual, perhaps just below this month’s low. In the short-term, FXY could be choppy, but the longer-term weekly chart removes the noise.
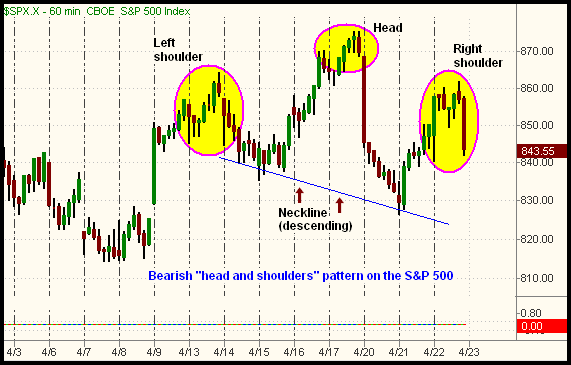
Three days ago, the S&P 500 tumbled more than 4% after running into major resistance of its late January and early February highs. The following day, the index snapped back to recover more than half of that loss. When the S&P 500 subsequently bounced even more yesterday afternoon, it formed the right shoulder of a bearish “head and shoulders” pattern on the hourly chart interval. Below, we’ve labeled this pattern on the hourly chart of the S&P 500 Index:

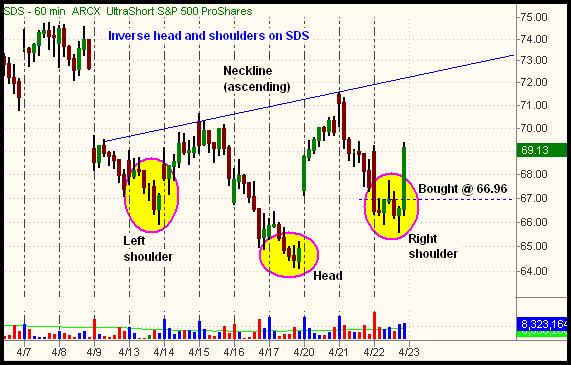
Upon noticing the near-perfect symmetry of the right shoulder with the left shoulder, we initiated a new ETF short position in the S&P 500. Because of the February 2009 resistance level, we believe the April 20 sell-off was the start of a significant, short-term downward correction in the S&P 500. However, since the April 20 drop was so sharp, we preferred to wait for a subsequent bounce into resistance, rather than selling short the breakdown near that day’s low. Instead of selling short S&P 500 SPDR (SPY) yesterday, we bought the inversely correlated UltraShort S&P 500 ProShares (SDS). If you flip the S&P 500 chart upside down, you’re basically looking at the chart of SDS. As the S&P 500 formed the right shoulder of a head and shoulders pattern, SDS conversely formed the right shoulder of an inverse head and shoulders, a bullish pattern:

With this S&P 500 short entry, realize this is only a short-term trade. For now, we’re only anticipating a pullback to the 50-day MA and 38.2% Fibonacci retracement in the S&P 500 (as illustrated in yesterday’s commentary). If the pullback doesn’t come, and the index corrects by time (consolidates) instead, we’ll trail our protective stop tighter to protect against a market rally to new highs.
Don’t forget we’re smack in the middle of corporate earnings season. Negative and positive earnings surprises from market-moving companies can exacerbate indecision and whippy trading conditions in the markets. As such, it may be wise to maintain both a minimal number of positions and smaller than average share size. Presently, we have only three open positions, and yesterday’s entry into SDS was entered with only about half our average share size. After the close of today’s trading, look for earnings reports from biotech giant Amgen (AMGN) and internet retailer king, Amazon.com (AMZN).
Today’s Watchlist:
There are no new setups in the pre-market today. We’re stalking FXY for potential entry, but we are not listing a pre-determined trigger price in the pre-market because FXY frequently gaps open. If we buy FXY, or anything else, we’ll promptly send an Intraday Trade Alert with details.
Daily Performance Report:
Below is an overview of all open positions, as well as a performance report on all positions that were closed only since the previous day’s newsletter. Net P/L figures are based on the $50,000 Wagner Daily model account size. Changes to open positions since the previous report are listed in red text below. Please review the Wagner Daily Subscriber Guide for important, automatic rules on trigger and stop prices.
-
Open positions (coming into today):
- Per Intraday Alert, we bought SDS yesterday afternoon. New trade details listed above.
- OIH stop has been tightened to lock in a gain in the event of a reversal, as it failed to hold yesterday’s breakout attempt above the April 17 high. New stop is just below the 20-EMA/60 min.
- Reminder to subscribers – Intraday Trade Alerts to your e-mail and/or mobile phone are normally only sent to indicate a CHANGE to the pre-market plan that is detailed in each morning’s Wagner Daily. We sometimes send a courtesy alert just to confirm action that was already detailed in the pre-market newsletter, but this is not always the case. If no alert is received to the contrary, one should always assume we’re honoring all stops and trigger prices listed in each morning’s Wagner Daily. But whenever CHANGES to the pre-market stops or trigger prices are necessary, alerts are sent on an AS-NEEDED basis. Just a reminder of the purpose of Intraday Trade Alerts.
- For those of you whose ISPs occasionally deliver your e-mail with a delay, make sure you’re signed up to receive our free text message alerts sent to your mobile phone. This provides a great way to have redundancy on all Intraday Trade Alerts. Send your request to [email protected] if not already set up for this value-added feature we provide to subscribers.
-
OIH long (100 shares from April 14 entry) – bought 83.85, stop 87.48, target 102.40, unrealized points = + 4.37, unrealized P/L = + $437
SDS long (150 shares from April 22 entry) – bought 66.96, stop 63.62, target 73.30, unrealized points = + 2.12, unrealized P/L = + $318
FXP long (400 shares from April 20 entry) – bought 20.75, stop 19.28, target 27.90, unrealized points = + 0.59, unrealized P/L = + $236
Closed positions (since last report):
-
(none)
Current equity exposure ($100,000 max. buying power):
- $27,720
Notes:
Edited by Deron Wagner,
MTG Founder and
Head Trader