Commentary:
Tuesday’s trading played out much like the prior session, as a strong morning trend failed to follow through in the afternoon once again. Just as Monday’s close disappointed the bulls, Tuesday’s late rally stumped those who were dipping their toes in the water on the short side after a sharp morning decline. The lack of a decisive action to either side hints at a possible bull-flag type of pattern to emerge, with a correction more by time than by price. As for now, indecision reigns supreme. The Dow Jones Industrial Average was noticeably stronger all session and closed in positive territory, up 0.6%. The S&P 500 reversed nearly 2% off the lows of the day and briefly went positive before closing down just 0.1% on the day. Tech stocks resumed last week’s trend of relative weakness, as the Nasdaq Composite fell 0.9% and the Nasdaq 100 dropped 1.3%. The small-cap Russell 2000 and S&P Midcap 400 matched the weakness in the Nasdaq, falling 1.4% and 1.0% respectively. <
/p>
The 8% pick up in volume on the NYSE revealed the buying interest on weakness, after an undercut of a five-day low in the S&P 500. Though the Nasdaq logged another bearish distribution day, total volume increased by only 0.6%, so the selling was not overwhelming. Declining volume beat advancing volume by a mild 2.5 to 1 on the S&P 500 and 2.7 to 1 on the Nasdaq.
Lets go over a few charts we are monitoring for entries on strength or weakness:
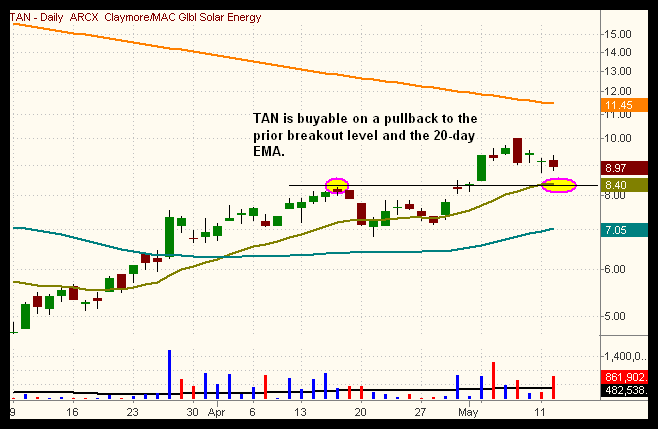
The chart of the Claymore Global Solar Index (TAN) above is pulling back to support of the 20-day EMA and the prior breakout pivot, and is buyable around the 8.00-8.40 level. There is also support from the uptrend line off the lows near 8.40.
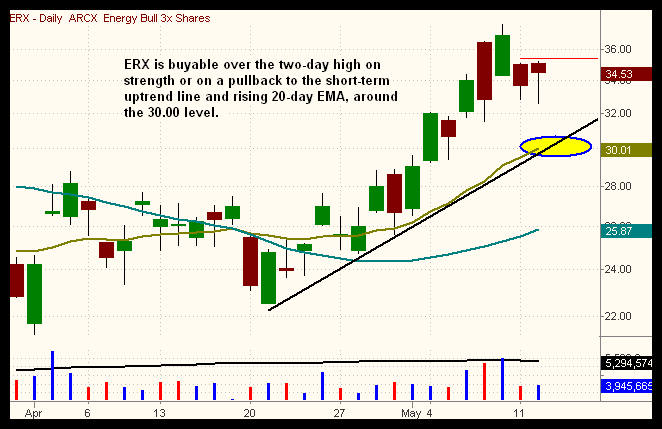
After breaking out from tight ranged consolidation in early May, the Direxion Energy Bull 3X (ERX) is consolidating in bullish fashion near the highs of the move, and is buyable over the two-day high or on a pullback to the rising 20-day EMA. The iShares US Oil & Gas Exploration ETF (IEO) is also strong, consolidating above the 200-day MA with a bull-flag type pattern.
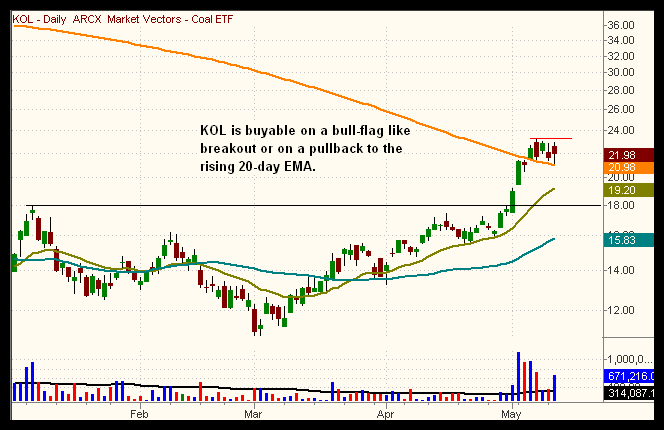
Sticking with the commodities theme, Market Vectors Coal ETF (KOL) is consolidating in bullish fashion, forming a tight ranged bull-flag pattern after breaking out from a four month long lower level base. Look for the rising 20-day EMA to catch up to the 200-day MA over the next few days.
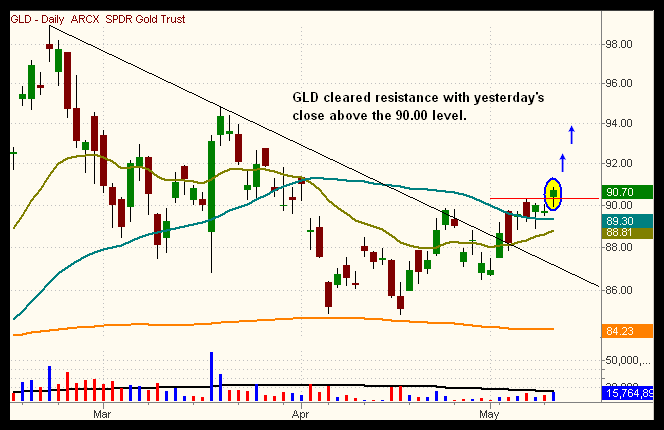
SPDR Gold ETF (GLD) closed above the three-day high and the 90.00 level, and looks poised for a run up to 94.00 in the short-term. GLD also confirmed the break of downtrend line by clearing the prior swing high of 4/24. Rather than buying gold, we are sticking with our silver long position (SLV), which is a showing a ton of relative strength on the chart below:
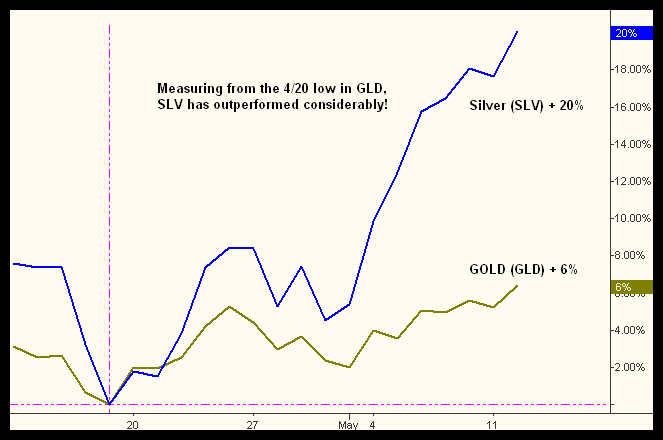
The chart above measures the percentage gain in SLV vs. GLD from the April 20 low in GLD.
Though we have been looking for a short-term pullback in the Nasdaq 100 it continues to close above the 200-day MA, so we could see a resumption of the uptrend with a move above the three-day high (over 1,412). Look for the S&P 500 to play catch up with the Nasdaq averages, as it has another 4% to go before hitting the 200-day MA. As we mentioned in yesterday’s report, we are focusing on commodity based ETF’s while the market chops around.
Today’s Watchlist:
There are no new setups in the pre-market today. But as always, we’ll promptly send an Intraday Trade Alert if we enter anything new.
Daily Performance Report:
Below is an overview of all open positions, as well as a performance report on all positions that were closed only since the previous day’s newsletter. Net P/L figures are based on the $50,000 Wagner Daily model account size. Changes to open positions since the previous report are listed in red text below. Please review the Wagner Daily Subscriber Guide for important, automatic rules on trigger and stop prices.
-
Open positions (coming into today):
- Per intraday alert, we establish a short-term, counter-trend position in QID.
- Reminder to subscribers – Intraday Trade Alerts to your e-mail and/or mobile phone are normally only sent to indicate a CHANGE to the pre-market plan that is detailed in each morning’s Wagner Daily. We sometimes send a courtesy alert just to confirm action that was already detailed in the pre-market newsletter, but this is not always the case. If no alert is received to the contrary, one should always assume we’re honoring all stops and trigger prices listed in each morning’s Wagner Daily. But whenever CHANGES to the pre-market stops or trigger prices are necessary, alerts are sent on an AS-NEEDED basis. Just a reminder of the purpose of Intraday Trade Alerts.
- For those of you whose ISPs occasionally deliver your e-mail with a delay, make sure you’re signed up to receive our free text message alerts sent to your mobile phone. This provides a great way to have redundancy on all Intraday Trade Alerts. Send your request to [email protected] if not already set up for this value-added feature we provide to subscribers.
-
UNG long (400 shares from May 6 entry) – bought 14.84, stop 14.22, target 19.80, unrealized points = + 2.62, unrealized P/L = + $1,044
SLV long (700 shares from May 4 entry) – bought 12.72, stop 12.22, target 15.12, unrealized points = + 1.30, unrealized P/L = + $903
FXY long (250 shares from April 24 entry) – bought 102.41, stop 99.48, target 112.20, unrealized points = + 0.83, unrealized P/L = + $205
QID long (250 shares from May 12 entry) – bought 37.80, stop 35.78, target (will send alert), unrealized points = (0.07), unrealized P/L = ($20)
Closed positions (since last report):
-
(none)
Current equity exposure ($100,000 max. buying power):
- $52,040
Notes:
Edited by Deron Wagner,
MTG Founder and
Head Trader