Commentary:
Broad market indices “played ‘possum” on Friday by chopping around all session long in a tight range until the final 15-minutes of trading, where price action surged almost 2% higher before the closing bell. End of the month trading is always tough to gauge, as funds jockey for desired positions to print on their books. Regardless of the reason, the swift closing rally lifted all indices comfortably in to positive territory, and capped off a solid month of gains (+5%) for the benchmark S&P 500. The small-cap Russell 2000 and S&P Midcap 400 indices closed higher by 1.9% and 1.6% respectively. Dow Jones Industrial Average advanced 1.5%, the S&P 500 1.4%, and the Nasdaq Composite advanced 1.3%.
Turnover was tracking lighter than the prior session on both exchanges at 3:30 pm, however, the late day surge was accompanied by big volume, enabling both the S&P 500 and Nasdaq Composite to register another “accumulation day.” Total volume in the NYSE was 10% greater than the previous day’s level, while trading in the Nasdaq rose 17%.
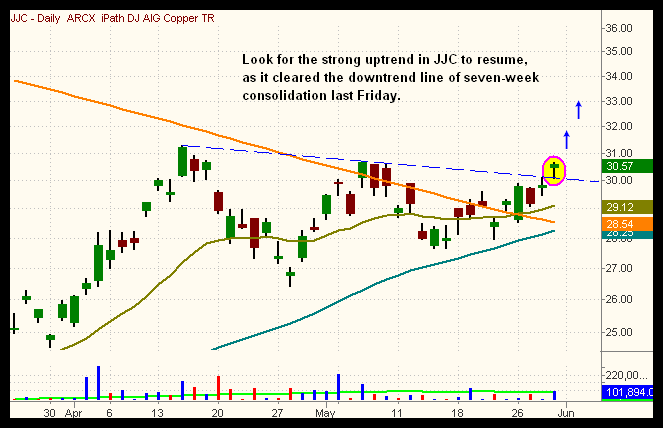
With financials and tech stocks taking a break over the past few weeks, commodities have taken center stage due to recent breakouts in gold, silver, and crude oil (courtesy of a declining dollar). One of the first commodities to blast higher when the market bottomed was copper:

Copper ETF (JJC) broke out from a lower level base in March and rallied more than 30% before stalling out below the 200-day MA. Since then, JJC has consolidated in bullish fashion above the 50-day MA. Last Friday JJC closed above the downtrend line of the triangle pattern, and is poised to resume the strong uptrend in place from the March breakout.
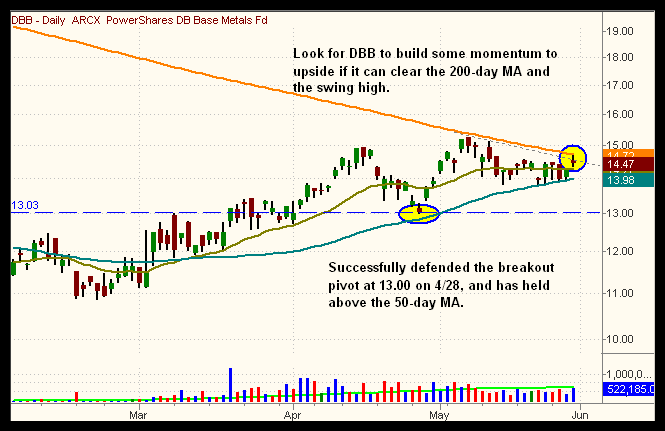
Though the pure play in copper is through JJC, one could participate in copper’s move while gaining exposure to base metals aluminum and zinc, via the Powershares DB Base Metals ETF (DBB). Throughout the year index weight will fluctuate, but the base weighting is 33% copper, 33% aluminum, and 33% zinc. The chart of DBB below shows the lower level base breakout at 13.00, followed by a successful test of the breakout pivot on 4/29, as it held above the 50-day MA. Volume has picked up nicely since the breakout, and a move above the 200-day MA should build upside momentum.

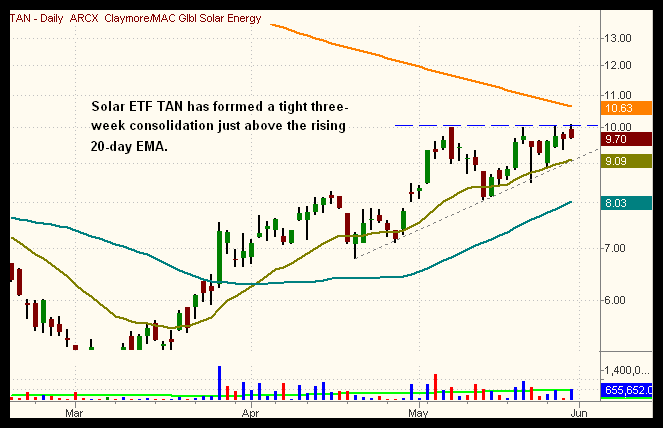
With crude oil moving higher, we revisit the chart of the Claymore Solar Energy Index (TAN). Though the 200-day MA sits just above, the tight-three week consolidation pattern should generate enough power to push through the long-term moving average. The ideal breakout scenario for TAN is to clear and separate from the 200-day MA, which would then become a strong level of support on a pullback (similar to the recent action in EWA).

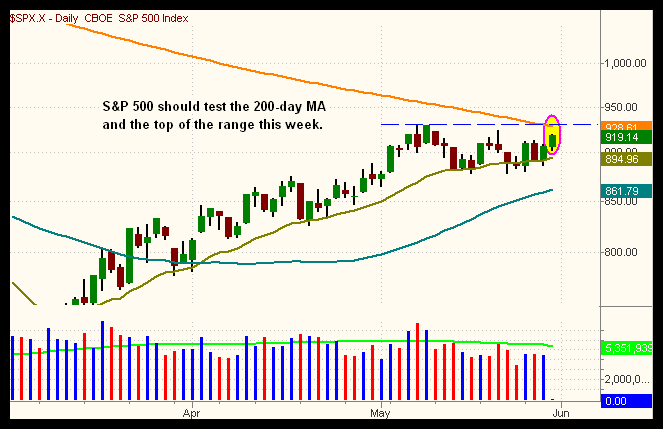
Late Thursday we reversed our UltraShort Financials position (SKF) and went long the bullish reversal bar in the Bank Index SPDR (KBE). Though it was a rough start on Friday morning, KBE recovered with the market to close above the prior day’s high, holding the downtrend line and the 20-day EMA. Our OIH long setup triggered on Friday morning’s gap up, and closed above the highs of the range. If energy and bank stocks can follow through to the upside, this would strengthen the S&P 500’s bid to break through the 200-day MA:

We could see the S&P 500 break above the 200-day MA this week, but whether or not it will hold the 200-day MA is another story. Rarely will a breakout above the 200-day MA be successful on the first attempt. Rather, it’s common for indexes, stocks, and ETFs to close above their 200-day MAs for one or two days, attract the “late to the party” bulls, then fall back down a few sessions later. There’s a greater chance a breakout above the 200-day MA will “stick” on successive attempts (similar to what the Nasdaq 100 did through May).
Stay alert this week, as a confirmed breakout above the 200-day MA in the S&P 500 could trigger substantial short covering in the market. Conversely, an inability of the S&P to bust through the 200-day MA could quickly lead to a sharp selloff to the 20-day EMA at 890, or a possible test/undercut of the range lows around 878.
Today’s Watchlist:
There are no new setups in the pre-market today. But as always, we’ll promptly send an Intraday Trade Alert if we enter anything new.
Daily Performance Report:
Below is an overview of all open positions, as well as a performance report on all positions that were closed only since the previous day’s newsletter. Net P/L figures are based on the $50,000 Wagner Daily model account size. Changes to open positions since the previous report are listed in red text below. Please review the Wagner Daily Subscriber Guide for important, automatic rules on trigger and stop prices.
-
Open positions (coming into today):
- The OIH buy entry triggered after the first five minutes of trading.
- Reminder to subscribers – Intraday Trade Alerts to your e-mail and/or mobile phone are normally only sent to indicate a CHANGE to the pre-market plan that is detailed in each morning’s Wagner Daily. We sometimes send a courtesy alert just to confirm action that was already detailed in the pre-market newsletter, but this is not always the case. If no alert is received to the contrary, one should always assume we’re honoring all stops and trigger prices listed in each morning’s Wagner Daily. But whenever CHANGES to the pre-market stops or trigger prices are necessary, alerts are sent on an AS-NEEDED basis. Just a reminder of the purpose of Intraday Trade Alerts.
- For those of you whose ISPs occasionally deliver your e-mail with a delay, make sure you’re signed up to receive our free text message alerts sent to your mobile phone. This provides a great way to have redundancy on all Intraday Trade Alerts. Send your request to [email protected] if not already set up for this value-added feature we provide to subscribers.
-
SLV long (900 shares total – 700 from May 4, 200 from May 19 entry) –
bought 13.01 (avg.), stop 14.28, target 15.82, unrealized points = + 2.46, unrealized P/L = + $2,205
FXY long (250 shares from April 24 entry) – bought 102.41, stop 100.80, target 112.20, unrealized points = + 1.98, unrealized P/L = + $493
KBE long (400 shares from May 28 entry) – bought 18.21, stop 17.73, target 21.69, unrealized points = + 0.65, unrealized P/L = + $256
OIH long (100 shares from May 29 entry) – bought 106.51, stop 104.70, target 120.40, unrealized points = (0.05), unrealized P/L = ($6)
Closed positions (since last report):
-
(none)
Current equity exposure ($100,000 max. buying power):
- $58,211
Notes:
Edited by Deron Wagner,
MTG Founder and
Head Trader