Commentary:
Stocks failed to capitalize on Wednesday’s strong closing action and sold off sharply during the morning session. All major averages were down 2% or more off the highs of the day by 11:30, having already undercut the prior day’s bullish reversal bar low. Stocks managed to push higher through the early afternoon but were once again put under pressure during the final hour of trading. The late selling allowed the major averages to close in the bottom third of the day’s range. The Dow Jones Industrial Average and the S&P 500 fell by 1.1% and 1.2% respectively. The S&P Midcap 400 lost 1.3%. The small-cap Russell 2000 finished 1.7% lower. The Nasdaq Composite was hit the hardest, giving back 1.9% thanks to Nasdaq leadership (Nasdaq 100) dropping 2.6%.
Total volume in the NYSE fell 14% off Wednesday’s pace. Nasdaq volume surged 15% with help from QCOM’s massive volume gap down. At this point we are monitoring broad market price and volume action for signs of heavy volume accumulation, which will determine whether or not a short or intermediate-term bottom may be forming.
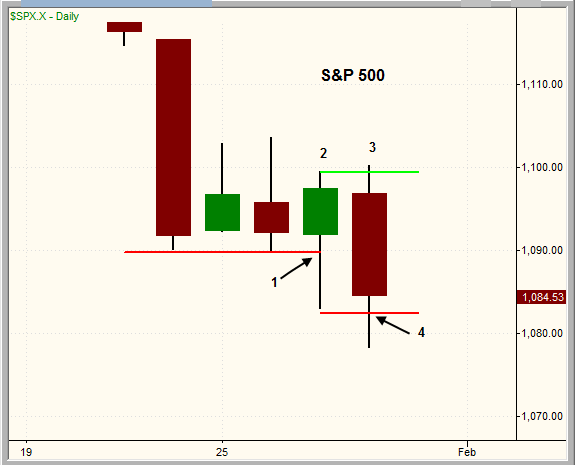
The daily chart below details the tricky price action and multiple head fakes in the S&P 500 over the past few days, with both the “late to the party” shorts and aggressive longs getting burned:

Point 1 – The S&P 500 breaks below the three-day low on Wednesday afternoon. This obvious breakdown lures the “late to the party” shorts in to action, as they don’t want to miss the next wave down.
Point 2 – By Wednesday’s close, the price action had reversed and formed bullish reversal bar. This reversal action looks to have scared the “late to the party” shorts in to covering, fearing they may have sold short at the dead lows of the move. The strong closing action was also a sign for aggressive traders to enter long positions in anticipation of follow through to the upside the next morning.
Point 3 – The slight move up in the morning probed above Wednesday’s high, which may have enticed a few more bulls into action, looking to cash in on a potential short-term rally.
Point 4 – The S&P fails to follow through and sells off sharply. The disappointing price action undercuts Wednesday’s low, which is probably where most of the aggressive longs placed their protective sell stops.
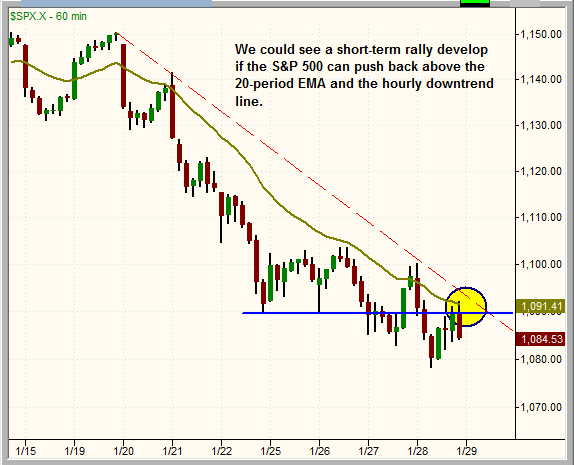
Though the aggressive buyers were clearly burned yesterday, the lack of follow through to the downside in the afternoon leaves the door open for a potential reversal in the S&P 500 tomorrow:

If the S&P 500 can climb back above the 20-period EMA and downtrend line on the hourly chart and hold (above 1,092), then we could see a potential short-term reversal develop either late Friday or Monday.
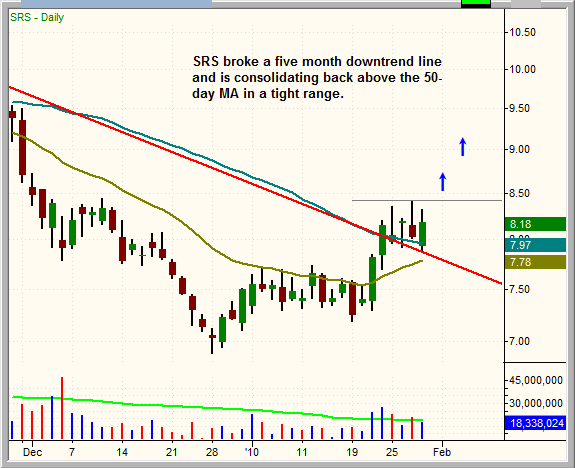
ProShares UltraShort Real Estate (SRS) is consolidating in a tight range after breaking above the downtrend line and the 50-day MA. If the broad market continues to sell off, then SRS may be buyable over the recent range highs. One could also wait for a pullback to enter SRS on weakness around the 7.60 – 7.70 area. Reference the weekly chart of SRS to get a clear picture of the recent downtrend line break.

Until the major averages reverse back above the hourly downtrend lines, the path of least resistance remains to the downside. Further selling in the S&P 500 could lead to a test of the October or November lows around 1,030.
Since the advance off the 2009 lows, broad based averages have avoided intermediate-term corrections of 10% or more, with most pullbacks finding support in the 4% to 6% range. During these shallow pullbacks, leadership stocks formed bullish patterns that eventually broke out and led the market higher. This correction is a bit different, as most leadership stocks are now in distribution mode after an extended advance, so it will take some time before new leadership emerges to once again lift this market higher.
Today’s Watchlist:
There are no new setups in the pre-market today. We’ll be sure to send an alert if anything catches our eye while scanning intraday.
Daily Performance Report:
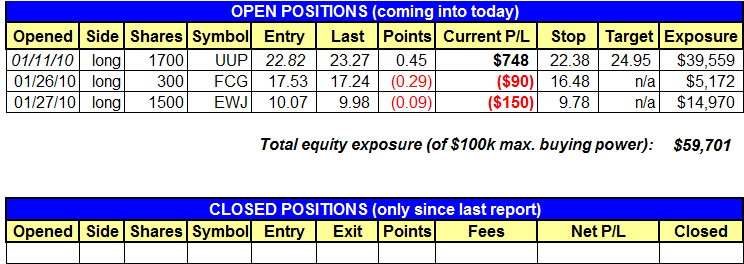
Below is an overview of all open positions, as well as a performance report on all positions that were closed only since the previous day’s newsletter. Net P/L figures are based on the $50,000 Wagner Daily model account size. Changes to open positions since the previous report are listed in red text below. Please review the Wagner Daily Subscriber Guide for important, automatic rules on trigger and stop prices.
- Reminder to subscribers – Intraday Trade Alerts to your e-mail and/or mobile phone are normally only sent to indicate a CHANGE to the pre-market plan that is detailed in each morning’s Wagner Daily. We sometimes send a courtesy alert just to confirm action that was already detailed in the pre-market newsletter, but this is not always the case. If no alert is received to the contrary, one should always assume we’re honoring all stops and trigger prices listed in each morning’s Wagner Daily. But whenever CHANGES to the pre-market stops or trigger prices are necessary, alerts are sent on an AS-NEEDED basis. Just a reminder of the purpose of Intraday Trade Alerts.
- For those of you whose ISPs occasionally deliver your e-mail with a delay, make sure you’re signed up to receive our free text message alerts sent to your mobile phone. This provides a great way to have redundancy on all Intraday Trade Alerts. Send your request to [email protected] if not already set up for this value-added feature we provide to subscribers.

Having trouble seeing the position summary graphic above?
Click here to view it directly on your Internet browser instead.
Notes:
Edited by Deron Wagner,
MTG Founder and
Head Trader