market timing model:
Buy – Signal generated on the close of November 23 (click here for more details)
today’s watchlist (potential trade entries):

Having trouble seeing the open positions graphic above? Click here to view it directly on your web browser instead.
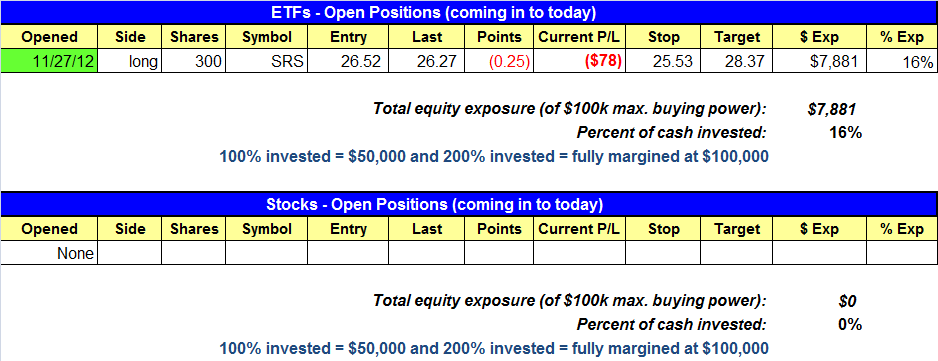
open positions:
Below is an overview of all open positions, as well as a report on all positions that were closed only since the previous day’s newsletter. Net P/L figures are based on two separate $50,000 model portfolios (one for ETFs and one for stocks). Changes to open positions since the previous report are listed in pink shaded cells below. Be sure to read the Wagner Daily subscriber guide for important, automatic rules on trade entries and exits.
Having trouble seeing the open positions graphic above? Click here to view it directly on your web browser instead.
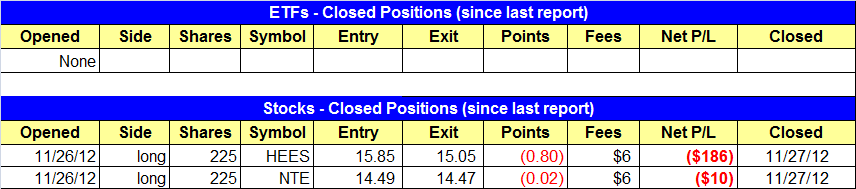
closed positions:
Having trouble seeing the closed positions graphic above?
Click here to view it directly on your web browser instead.
ETF position notes:
- SRS buy stop triggered. SMN buy setup is cancelled.
stock position notes:
- Sold HEES on the open for a $180 loss. NTE hit our break-even stop.
ETF and broad market commentary:
Stocks took a breather yesterday, as the main stock market indexes pulled back on higher volume. The Nasdaq Composite, S&P 500, and Dow Jones Industrials slipped an average of 0.5%. Both the small-cap Russell 2000 and S&P MidCap 400 indices edged 0.2% lower. Considering the sharp move off the November 16 lows, a bit of a pullback was not surprising. However, one concerning element of yesterday’s price action is that the decline occurred on higher volume. With turnover in both the NYSE and Nasdaq registering about 10% higher than the previous day’s levels, yesterday was a “distribution day” that was indicative of stealth selling into strength among banks, mutual funds, hedge funds, and other institutions.
Although our market timing model generated a new “buy” signal at the close of trading on November 23, we have said over the past several days that the new buy signal needed to be confirmed in order to have validity of a significant bottom being formed. For that to happen, we said there needed to be the emergence of fresh leadership among select individual stocks, as well as a lack of higher volume selling (“distribution days”) this week. But there remains a lack of impressive breakouts among leading stocks, as well as the occurrence of yesterday’s higher volume selling. Furthermore, don’t forget that several of the main stock market indexes have just run into major technical levels of overhead price resistance. As such, it is fair to say our new buy signal remains unconfirmed, and the broad market is presently giving overall mixed technical signals.
Since the buy signal is not yet confirmed, it is fine to continue focusing on selling short select ETFs and individual stocks with bearish chart patterns and relative weakness. Yesterday, our trade setup in ProShares UltraShort Real Estate Index Fund ETF ($SRS), an inversely correlated “short ETF” triggered for buy entry by rallying above the previous day’s high. Now, we are adding another inversely correlated ETF to our watchlist for potential buy entry in today’s session.
Now, we are targeting the inversely correlated ProShares UltraShort Basic Financials ETF ($SKF) for potential swing trade buy entry. Like $SRS and $SMN, $SKF was the third inversely correlated ETF we recently profited from by buying the early November breakout above resistance, then subsequently selling into strength near the mid-November highs. Now, the technical chart pattern of $SKf is presenting us with a low-risk pullback buy entry going into today’s session. Take a look:

Similar to the other two inversely correlated ETFs mentioned above, $SKF “undercut” horizontal price support two days ago, but quickly snapped back above that level of support in yesterday’s session. Notice how the ETF is now trading back above its 50-day moving average, as well as its horizontal price support. Furthermore, volume of $SKF in yesterday’s session was approximately double its 50-day average level. This tells us there was institutional buying interest, which could aid in sending the ETF back up to test its prior highs over the next one to two weeks (accordingly, the underlying financial sector is poised to move lower). As you will see on the ETF Watchlist section of the newsletter above, our trigger for buy entry is just above yesterday’s high, which corresponds to a breakout above the three-day high, as well as a recovery above the 20-day exponential moving average. With this setup, we are able to set a clearly defined stop price just below the three-day low.
In this recent post on our trading blog, we pointed out the abundance of overhead resistance in the small-cap iShares Russell 2000 Index ETF ($IWM). Note on the chart below that $IWM formed a bearish shooting star candlestick yesterday, after failing to break out above resistance of its multi-month downtrend line from the September 2012 high. This also occurred after $IWM probed above (“overcut”) its 200-day moving average and horizontal price resistance. Now that there has been a shakeout, and the short selling entry point is not so obvious, this swing trade setup provides us with a low-risk entry point for a new short sale on $IWM. The technical chart pattern for the setup is illustrated on the daily chart below:

To benefit our subscribers with non-marginable cash accounts (such as IRA accounts), we are stalking the inversely correlated ProShares Short Russell 2000 ETF ($RWM) for potential buy entry, rather than actually selling short $IWM. But if you have a marginable account and are willing and able to initiate short sales, you may prefer to just sell short $IWM, rather than buying $RWM, if the swing trade setup triggers for entry (just use our signals for RWM to determine when to enter and exit $IWM). On the other hand, some traders may even prefer to buy ProShares UltraShort Russell 2000 ETF ($TWM), a double leveraged version of $RWM. However, we generally prefer to avoid leveraged ETFs whenever possible because they frequently have a tendency to slightly underperform their respective underlying indexes as the holding period increases.
In conclusion, our “official” trade setup is to buy RWM on a move above yesterday’s high, but selling short IWM, or buying TWM, using our signals for when to enter and exit RWM, is fine. With an initial price target for $RWM in the area of its prior high, this creates a very positive reward to risk ratio of about 3 to 1 (potential upside profit is three times the initial risk, based on initial stop price). Our minimum requirement for swing trading setups is a reward-risk ratio of 2 to 1.
Because we have two new ETF swing trade setups added to today’s watchlist ($SKF and RWM), we have eliminated ProShares UltraShort Basic Materials ETF ($SMN) from our watchlist. We still like the $SMN trade setup, but given the new and unconfirmed buy signal on our market timing system, we do not want to assume too much short exposure at this time. Note that each inversely correlated ETF trade setup on today’s watchlist is also sized at just 50% our maximum risk per trade, based on the model ETF trading portfolio.
stock commentary:
NTE hit our break-even stop and we are out. In reviewing our stop manangement, we may have been too quick to raise the stop to a break-even level. Why? We already had risk under control by going with reduced share size, so there was no need to reduce risk. Had we put on heavier size, then raising the stop for half the position would have made sense. We will continue to monitor the action for a potential re-entry point.
One of the strongest groups in the market right now is the Oil and Gas Refining group. $CVI, $TSO, $HFC, $ALJ, and $DK all look pretty good. We are monitoring the group for a low-risk entry point sometime this week or next.
There are no new official setups for today. Overall, our scans look pretty good with most stocks in the top 40 industry groups in good shape. The overall strength of our scans leads us to believe that if market sells off after stalling at resistance, the next move down will not lead to new lows.
If you are a new subscriber, please e-mail [email protected] with any questions regarding our trading strategy, money management, or how to make the most out of this report.
relative strength combo watchlist:
Our Relative Strength Combo Watchlist makes it easy for subscribers to import data into their own scanning software, such as Tradestation, Interactive Brokers, and TC2000. This list is comprised of the strongest stocks (technically and fundamentally) in the market over the past six to 12 months. The scan is updated every Sunday, and this week’s RS Combo Watchlist can be downloaded by logging in to the Members Area of our web site.