market timing model:
Buy – Signal generated on the close of December 31 (click here for more details)
today’s watchlist (potential trade entries):

Having trouble seeing the open positions graphic above? Click here to view it directly on your web browser instead.
open positions:
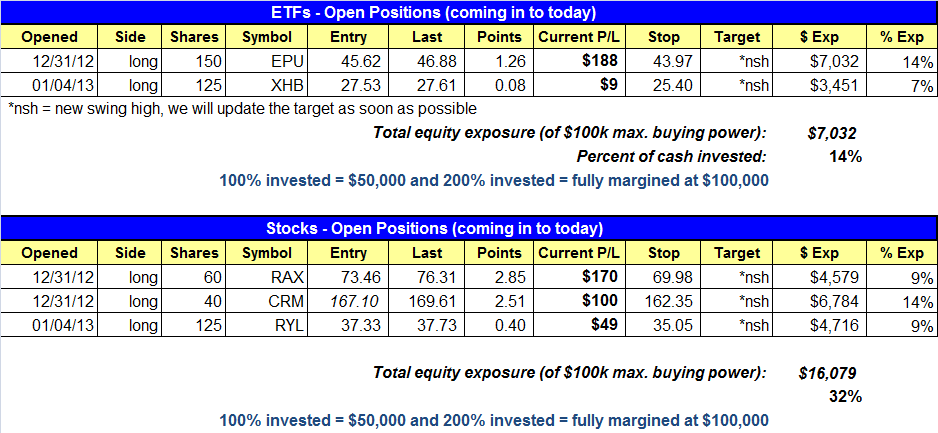
Below is an overview of all open positions, as well as a report on all positions that were closed only since the previous day’s newsletter. Net P/L figures are based on two separate $50,000 model portfolios (one for ETFs and one for stocks). Changes to open positions since the previous report are listed in pink shaded cells below. Be sure to read the Wagner Daily subscriber guide for important, automatic rules on trade entries and exits.

Having trouble seeing the open positions graphic above? Click here to view it directly on your web browser instead.
closed positions:

Having trouble seeing the closed positions graphic above? Click here to view it directly on your web browser instead.
ETF position notes:
- $XHB buy entry triggered.
stock position notes:
- $RYL buy entry triggered. $LULU stop triggered at the open and we are out.
ETF and broad market commentary:
All major averages closed in positive territory on Friday; however, the S&P 500 managed to push slightly higher with a 0.5% gain while AAPL’s 3% loss weighed on the Nasdaq Composite, which only closed up 0.1%. The Nasdaq basically formed an inside day, with most of Friday’s trading taking place within Thursday’s price range. As we mentioned last week, a little sideways action after a major thrust is to be expected.
Volume was mixed on the session, with NYSE volume coming in about 10% lighter than the prior day’s pace. Although Nasdaq volume was slightly higher (less than 1%) we are not concerned, as there were no signs of stalling intraday. Overall, we continue to see a bullish volume pattern in the broad market averages. As long as new breakouts keep working and the market avoids distribution, we have to assume that a new bull market is under way.
We established one new long position in the SPDR S&P Homebuilders ETF ($XHB) on Friday. Our breakout buy setup in the iShares MSCI Singapore Index ($EWS) did not trigger, but we’ll continue to monitor the action for a potential pullback entry off support of the 20-day EMA (if it gets there).
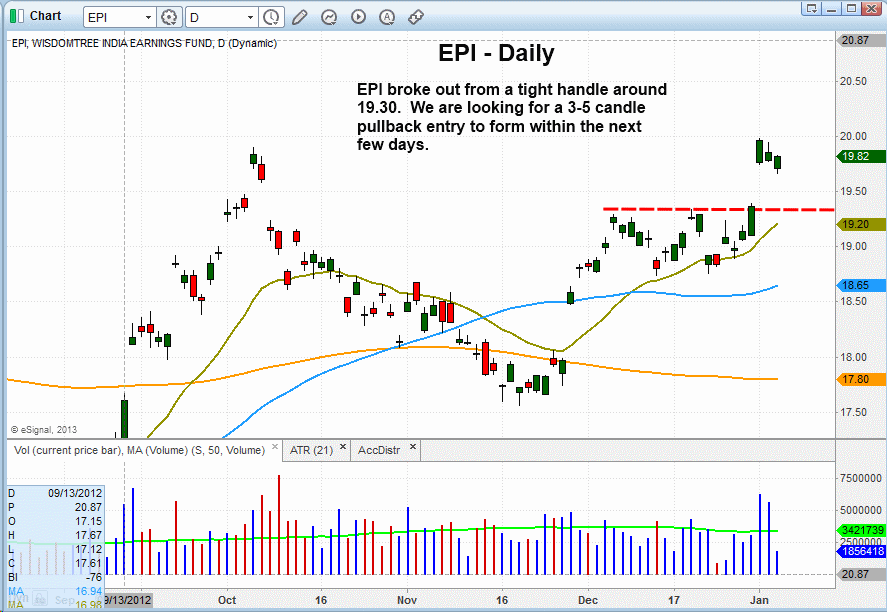
Another potential pullback entry we are monitoring is in the WisdomTree India Earnings Fund ($EPI). $EPI broke out from a tight four week consolidation (or handle) on a nice pick up in volume, which is a bullish sign. The tight consolidation held above the 20-day EMA before breaking out on January 2. We are looking for a three to five candle pullback that finds support somewhere in the 19.50 area. $EPI does not have to pull back at all and could simply just go sideways for a day or two before resuming its uptrend.

On the stock side, we lost $LULU to a downgrade on Friday. Our stop triggered on the opening gap down, but $LULU did manage to close back above the 50-day MA. That being said, due to its poor performance the past three days, LULU’s relative strength ranking is now 62. We do not buy stocks with a relative strength ranking less than 80 unless it is a new, first year IPO with excellent technicals and fundamentals.
From our weekend scans it was clear to see that the market has put in an impressive thrust off the lows. If current breakouts hold the market should be in great shape. The large move up has not left us with many low-risk setups, but we were able to locate one low risk buy entry in $ARNA. $ARNA has the best relative strength ranking in its industry group at 99. We also liked $HLSS as a breakout entry above the three-day high; however, earnings are scheduled for Jan. 14, so we are passing on the setup.
If you are a new subscriber, please e-mail [email protected] with any questions regarding our trading strategy, money management, or how to make the most out of this report.
relative strength combo watchlist:
Our Relative Strength Combo Watchlist makes it easy for subscribers to import data into their own scanning software, such as Tradestation, Interactive Brokers, and TC2000. This list is comprised of the strongest stocks (technically and fundamentally) in the market over the past six to 12 months. The scan is updated every Sunday, and this week’s RS Combo Watchlist can be downloaded by logging in to the Members Area of our web site.