Sell Mode
– Timing model generated sell signal on close of February 25 (click here for more details)
today’s watchlist (potential trade entries):

Having trouble seeing the open positions graphic above? Click here to view it directly on your web browser instead.
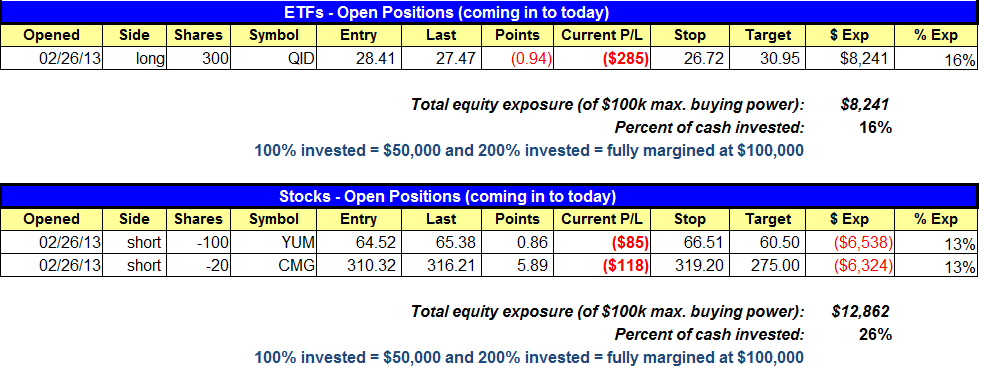
open positions:
Below is an overview of all open positions, as well as a report on all positions that were closed only since the previous day’s newsletter. Net P/L figures are based on two separate $50,000 model portfolios (one for ETFs and one for stocks). Changes to open positions since the previous report are listed in pink shaded cells below. Be sure to read the Wagner Daily subscriber guide for important, automatic rules on trade entries and exits.
Having trouble seeing the open positions graphic above? Click here to view it directly on your web browser instead.
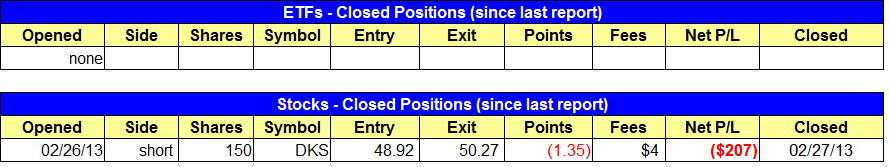
closed positions:
Having trouble seeing the closed positions graphic above? Click here to view it directly on your web browser instead.
ETF position notes:
- No trades were made.
stock position notes:
- $DKS buy stop triggered and we coverd our short position for a $200 loss.
ETF, stock, and broad market commentary:
Stocks followed through on Tuesday’s reversal action with impressive gains across the board. All major averages gained at least 1.0%, with the S&P 500 and Dow Industrials leading the way at +1.3%. The rally was broad based, with 217 of the 239 industry groups we follow closing in positive territory.
While on the surface it seems that Wednesday’s advance was powerful, there was one very big piece of the puzzle missing and that was volume. Turnover actually decreased by 11% on the NYSE and by 6% on the Nasdaq. The light volume was surprising given the large percent move and broad participation. The NYSE and Nasdaq volume pattern remains bearish (higher volume down days and lighter volume up days), as we have yet to see a bullish accumulation day in the past few weeks. We’d like to see at least one accumulation day print in a major index before we jump back in to the market on the long side.
We remain long $QID, and although the price action yesterday was not ideal, we must keep in mind that this is the same market that just produced three distribution days in four sessions. Our entry in $QID was based on two bearish reversal candles in $QQQ on 2/20 and 2/25. As long as $QQQ does not push to new swing highs the setup is valid.
Most leading ETFs or stocks are in need of a few weeks of rest after a decent advance and recent increase in volatility:
iShares Dow Jones Transportation ETF ($IYT) broke out from a 10-month long base and rallied about 15% before stalling out. Note the pick up in volatility the past two weeks. This is a sign that the price action may need a few weeks of base building. A 4-5 week base above the 50-day MA would be ideal.

First Trust DJ Internet Index Fund ($FDN) failed a recent continuation breakout to highs and has pulled back to the 50-day moving average. Like $IYT, $FDN needs another a few more weeks of sideways consolidation above the rising 50-day MA.

iShares Dow Jones US Oil & Gas Exploration ($IEO) has recently pulled back to the 50-day MA after a base breakout at 66.00. Note the pick up in volatility on the way down to the 50-day MA. As $IEO digests the recent advance over the next few weeks, the price action should tighten up while setting higher lows within the base.

On the stock side, several big cap leaders are holding up: $LNKD, $NFLX, $KORS, $AIG, $GS, $BAC, $JPM, $YHOO, $VLO, $VMED, and $HD are a few. We also keep tabs on what relative strength stocks are breaking down below the 50-day MA, and they are: $FSLR, $SSYS, $VSI, $HSNI, $MHO, $DDD, $RNF, $VMC, $RKUS, $VAC, $DDS, $GNRC,$LCC, $RYL, $REGN, $LEN, and $URBN.
As mentioned above, we have no problem returning to the long side within the next few days if setups are there and a major average prints an accumulation day.
For now, we remain short $CMG and $YUM, with $DKS stopping us out yesterday afternoon.
If you are a new subscriber, please e-mail [email protected] with any questions regarding our trading strategy, money management, or how to make the most out of this report.
relative strength combo watchlist:
Our Relative Strength Combo Watchlist makes it easy for subscribers to import data into their own scanning software, such as Tradestation, Interactive Brokers, and TC2000. This list is comprised of the strongest stocks (technically and fundamentally) in the market over the past six to 12 months. The scan is updated every Sunday, and this week’s RS Combo Watchlist can be downloaded by logging in to the Members Area of our web site.