Buy
– Signal generated on the close of April 30
We are now in confirmed buy mode, which means that we can go on margin if needed.
today’s watchlist (potential trade entries):

Having trouble seeing the open positions graphic above? Click here to view it directly on your web browser instead.
open positions:
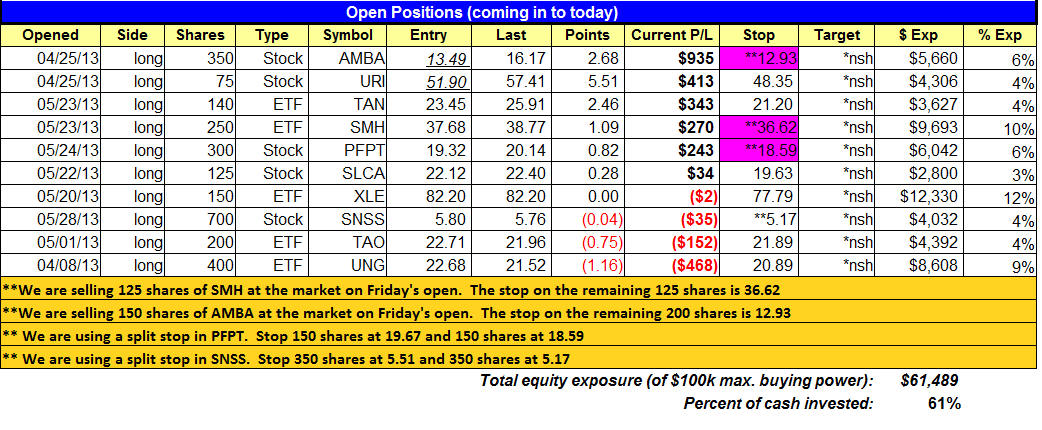
Below is an overview of all open positions, as well as a report on all positions that were closed only since the previous day’s newsletter. Net P/L figures are based a $100,000 model portfolio. Changes to open positions since the previous report are listed in pink shaded cells below. Be sure to read the Wagner Daily subscriber guide for important, automatic rules on trade entries and exits.

Having trouble seeing the open positions graphic above? Click here to view it directly on your web browser instead.
closed positions:

Having trouble seeing the closed positions graphic above? Click here to view it directly on your web browser instead.
ETF position notes:
- Sold $EIDO on the open for a smaller than average loss. Note that we are selling partial size in $SMH on the open.
stock position notes:
- Note that we are selling partial size in $AMBA on the open.
ETF, stock, and broad market commentary:
Stocks slowly ticked higher most of the day before selling off into the close. Although the late selling action took a bite out of the day’s advance, the Nasdaq, Russell, and Mid-cap 400 all closed with a decent gain. Turnover was mixed, and there was no sign of distribution or accumulation in either exchange. Overall, it was a boring session, and with the market settling in to a trading range, we can expect to see more chop over the next week or two.
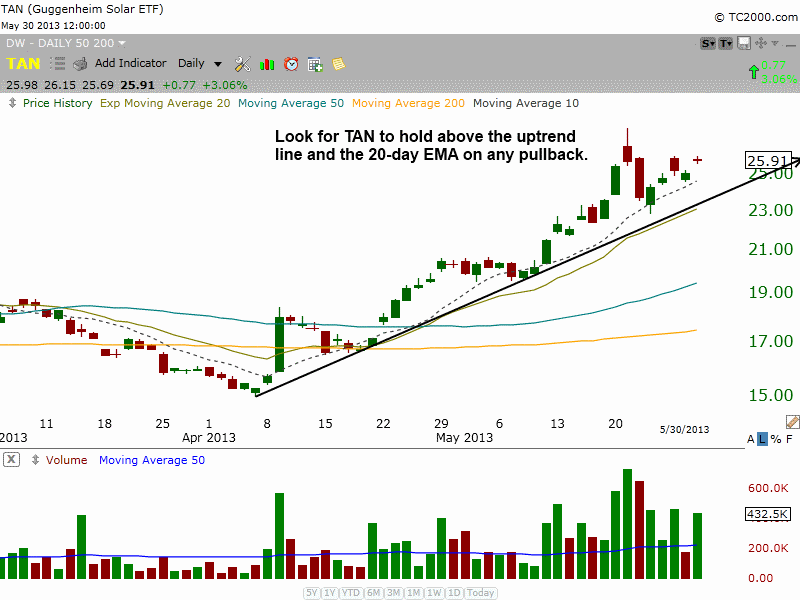
After finding support around $23, Claymore/MAC Global Solar Index ($TAN) continues to push higher above the rising 10-day MA. The daily chart below details the support in $TAN.

Should $TAN fail to punch through $26 and pull back in (for a week or two), then there is solid support from the uptrend line and the 20-day EMA around $23.
As mentioned earlier this week, our ETF scans have not produced much in the way actionable setups, so a short-term break in the market should eventually produce some low risk buy points. Until then we will remain patient and focus on managing existing positions.
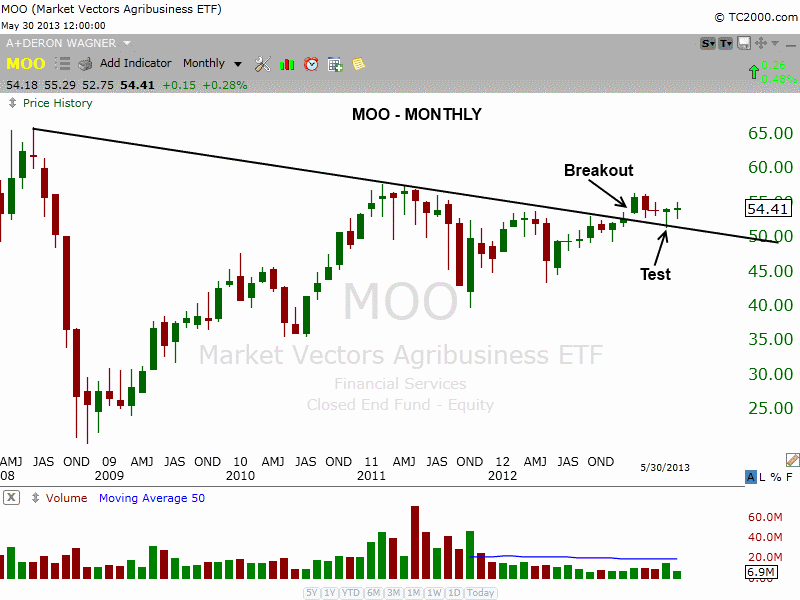
Although commodity based stocks have been a big laggard this year, we have noticed some relative strength in the the Market Vectors Agribusiness ($MOO). After breaking a long-term downtrend line and successfully testing that line last month, if the price action continues to trade in a tight range, then we could possibly see a breakout entry emerge down the road ($MOO is not actionable right now).

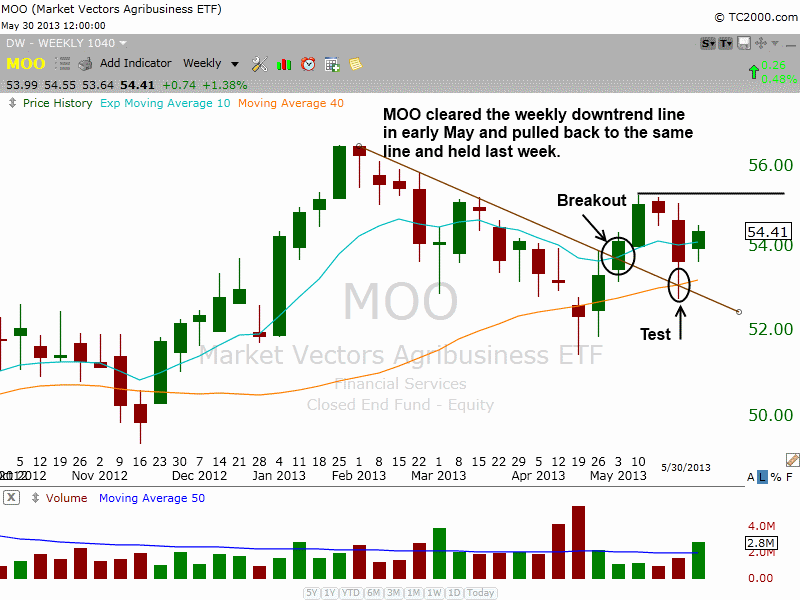
Dropping down to a weekly chart, we see the 10-day MA (teal line) above the 40-week MA (orange line). And like the test of the downtrend line on the monthly chart above, we see the same below with last week’s test of the downtrend line and the 40-week MA. For this setup to remain constructive the price action should hold above the 40-week MA and the higher swing low. It may take several weeks for the price to tighten up on the right hand side, so we will place $MOO on a second tier watchlist (one that is reviewed only on the weekend).

On the stock side, we are selling partial shares of $AMBA at market on the open. $AMBA is scheduled to report earnings on June 4, so we are locking in some gains as we plan to hold through the report (sell the full position if you do not want to hold through earnings).
Please note the split stops in $PFPT and $SNSS. $SLCA and $URI remain in good shape, and we are simply waiting for a low risk buy point to add to these positions.
With $KORS breaking out while the market is in consolidation mode, the odds favor some sort of pullback to or around the prior breakout pivot. $KORS has top line fundamentals and is trading at all time highs with an RS ranking of 80. The breakout was confirmed by strong volume, so it is just a matter of waiting for a low risk entry point to develop.