market timing model:
Neutral – Signal generated on the close of August 2 (click here for more details)
today’s watchlist (potential trade entries):

Having trouble seeing the open positions graphic above? Click here to view it directly on your web browser instead.
open positions:
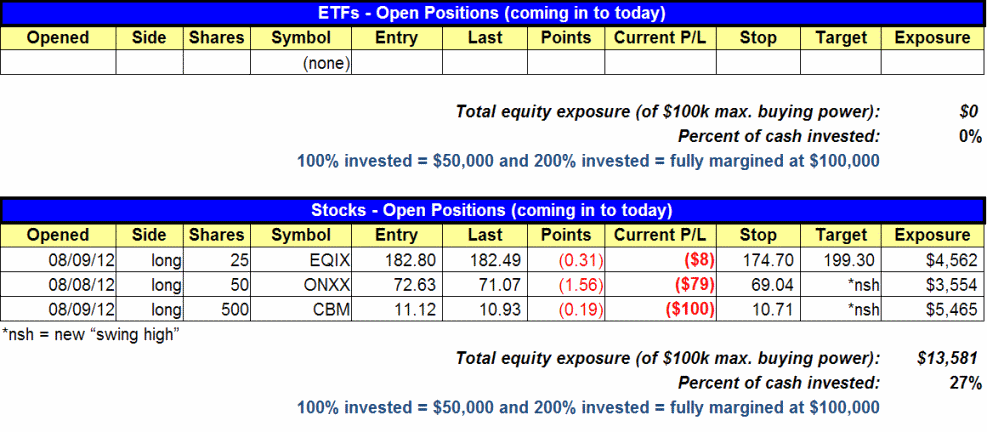
Below is an overview of all open positions, as well as a report on all positions that were closed only since the previous day’s newsletter. Net P/L figures are based on two separate $50,000 model portfolios (one for ETFs and one for stocks). Changes to open positions since the previous report are listed in red shaded cells below. Be sure to read the Wagner Daily subscriber guide for important, automatic rules on trade entries and exits.

Having trouble seeing the open positions graphic above? Click here to view it directly on your web browser instead.
closed positions:

Having trouble seeing the closed positions graphic above? Click here to view it directly on your web browser instead.
ETF position notes:
- Despite a very encouraging start on the day of entry, UNG reversed sharply and hit our stop one day later. Because we have not yet been seeing much follow-through in the market, our market timing model fortunately has been forcing us to reduce share size on all new trade entries to about half the normal risk. Therefore, the loss in UNG was relatively small.
- There are three setups on the watchlist today. Note the adjusted trade parameters (pink shaded cells) for the IBB trade, which has been on our watchlist since last week. The other two setups (DVY and EWW) are new entries to the swing trading watchlist.
stock position notes:
- No changes to the stops in CBM, EQIX, or ONXX at this time. With a little help from the market, all three positions should be in good shape. But if not, that’s what protective stops are for (always use them).
ETF and broad market commentary:
After gapping lower on the open, the broad market oscillated in a tight range, in slightly negative territory, for most of the session. However, stocks caught a bid in the final hour of trading, enabling most of the main stock market indexes to finish modestly higher. The Dow Jones Industrial Average and S&P 500 indices tacked on 0.3% and 0.2% respectively. Both the Nasdaq Composite and the S&P MidCap 400 edged 0.1% higher. The small-cap Russell 2000 was the only major index to lose ground, as it slipped 0.2% on the session. As mentioned several times last week, we’re keeping a close eye on the small and mid-cap indexes, as new leadership in those growth indexes may be the impetus the market needs to break out to the upside.
Market internals were mixed on Friday. Turnover on the Nasdaq fell by 6.9%, as volume on the NYSE receded 11.8%. In the Nasdaq, advancing volume was on par with declining volume, but the NYSE adv/dec volume ratio was positive by a ratio of nearly 2 to 1. The light volume suggests that institutional investors were absent from the market last Friday, which was not surprising given the typically slow month of August.
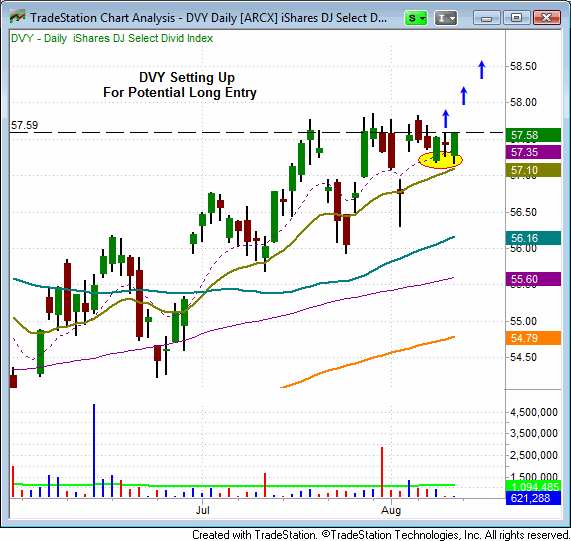
Over the past several weeks, the iShares Dow Jones Select Dividend Index ETF ($DVY) has been consolidating near its multi-year high. With the exception of one day (July 31), volume has also been coming in lighter than average (a bullish sign when stocks are consolidating for potential breakout). Over the past three days, the trading range has tightened up substantially, which is often a precursor to a breakout from consolidation. Just below last Friday’s low lies near-term support of the 20-day exponential moving average (EMA). Now, we are targeting DVY for a potential breakout entry, which would occur on a volume-fueled move above last Friday’s (August 10) high of $57.59. This buy setup in DVY is an “official” play that has been added to our watchlist, where you will find our detailed trade parameters. The daily chart pattern of DVY is shown below:

Along with DVY, iShares Nasdaq Biotech Index ($IBB) remains on our watchlist from last week, albeit with an adjusted trigger price. The ETF continues to consolidate in a tight range, on a pullback from its all-time high, neatly holding support of its 20-day MA. Additionally, we have added iShares Mexico ($EWW) to our watchlist as a breakout candidate (refer to our August 10 newsletter for a review of the trade setup). Because both IBB and EWW are showing relative strength to the major indices, they are well positioned for a rally to new highs if the broad market continues to act well.
The main stock market indexes have drifted in a tight, sideways range for the past four sessions. Since volume during this period has been light, it is a sign the bulls are merely sitting on the sidelines, rather than selling into strength of the recent move. The longer stocks consolidate near the highs of the recent rally, the greater the odds of a resumption of the upward trend, at least in the near-term. It’s also notable that the major indices closed at their intraday highs last Friday, which is a positive change from the weak closing action of the preceding three days. Nevertheless, don’t forget that the Nasdaq, S&P 500, and Dow Jones Industrial Average all remain at or near key resistance levels, so caution on the long side is warranted. Further, leadership among growth stocks continues to be lacking. Given the mixed signals the stock market has been displaying lately, we’re quite comfortable with our market timing model staying in “neutral” mode for now.
stock commentary:
Because we already have three (partial-sized) open stock positions in our model portfolio, there are no new stock trade setups on today’s watchlist. Our stock screener is showing a few other stocks with bullish chart patterns, both potential breakouts and pullback entries. However, it makes sense to wait until our current stock positions prove themselves and follow-through before entering additional trades. Although we have a few new ETF setups today, two of them have a relatively low correlation to the direction of the U.S. stock market (one international ETF and one dividend ETF).
If you are a new subscriber, please e-mail [email protected] with any questions regarding our trading strategy, money management, or how to make the most out of this report.
relative strength combo watchlist:
Our Relative Strength Combo Watchlist makes it easy for subscribers to import data into their own scanning software, such as Tradestation, Interactive Brokers, and TC2000. This list is comprised of the strongest stocks (technically and fundamentally) in the market over the past six to 12 months. The scan is updated every Sunday, and this week’s RS Combo Watchlist can be downloaded by logging in to the Members Area of our web site.
NOTE: This week, the Relative Strength Combo Watchlist will not be updated until Wednesday. In the meantime, you may still download the previous week’s watchlist because not much has changed since then.