Current signal generated on close of November 13.
Portfolio exposure can be anywhere from 25% to 50% long. If positions are holding up well, then one can add exposure beyond 50%.
Past signals:
- Neutral signal generated on close of November 6.
- Buy signal generated on close of September 9
- Neutral signal generated on close of August 15
- Buy signal generated on close of July 11
- Neutral signal generated on close of July 5
- Sell signal generated on close of June 24
today’s watchlist (potential trade entries):

Having trouble seeing the open positions graphic above? Click here to view it directly on your web browser instead.
open positions:
Below is an overview of all open positions, as well as a report on all positions that were closed only since the previous day’s newsletter. Changes to open positions since the previous report are listed in pink shaded cells below. Be sure to read the Wagner Daily subscriber guide for important, automatic rules on trade entries and exits.

Having trouble seeing the open positions graphic above? Click here to view it directly on your web browser instead.
closed positions:

Having trouble seeing the closed positions graphic above? Click here to view it directly on your web browser instead.
ETF position notes:
- Bought $PIZ
stock position notes:
- No trades were made.
ETF, stock, and broad market commentary:
This week’s holiday schedule:
- Wednesday Nov. 27 – Wednesday’s Q&A webinar is canceled
- Thursday, Nov. 28 – Market is closed
- Friday, Nov. 29 – Market closes early at 1 pm est.
- Due to Friday’s early close, we will publish an abbreviated version of the Wagner Daily on Thursday night. There will be no commentary, but we will update the watchlist, open, and closed position sections.
Stocks closed out the week in positive fashion, with most broad market averages setting a new closing high for the year. Of the five major averages we cover on a daily basis, the Midcap S&P 400 was the only index not to set a new 52-week high or new 52-week closing high last week.
Turnover was mixed on the session, with NADSAQ volume ticking higher while the S&P 500 and Dow Jones pushed to new highs on lighter volume.
With the financial and energy sectors hitting new highs on the year, the S&P 500 has decent momentum and will probably continue to push higher. The healthcare sector continues to drive the NASDAQ Composite, led by a strong breakout to new highs in the biotech ETF ($IBB).
Gold and silver, as well as the mining stocks continue to struggle, with many breaking down to new 52-week lows on the year. These stocks and ETFs may present us with decent short entries on a bounce within the next few weeks.
After a strong move to the prior swing high last Wednesday, $TBT has backed off the past few days and pulled back in, stopping just shy of the 20-day EMA.
We like the price action in $TBT over the past few weeks, as it held support at the test of the downtrend line in mid-November. We look for $TBT to hold above the 50-day MA as it chops around for a bit to digest last week’s movement.

The 50-day MA is still sloping lower, but the 20-day EMA is now above the 50-day MA and trending higher. The 200-day MA is also in a clear uptrend, so as soon as the 50-day MA begins to trend higher $TBT should be ready to resume its uptrend.
We are placing $TBT on today’s watchlist as an official buy. Trade details can be found in the watchlist section above.
We added one new long position to our ETF holdings in $PIZ last Friday. $PIZ is not a fast mover, but it remains in a strong uptrend, so as long as the action continues to trade in a tight range we should eventually see a breakout to new highs and resumption of its uptrend.
On the stock side we have three new buy setups in smaller cap issues, $TKMR, $RCON, and $KNDI. Both $KNDI and $TKMR are downtrend line breakout entries, while $RCON is basically a breakout to new highs.
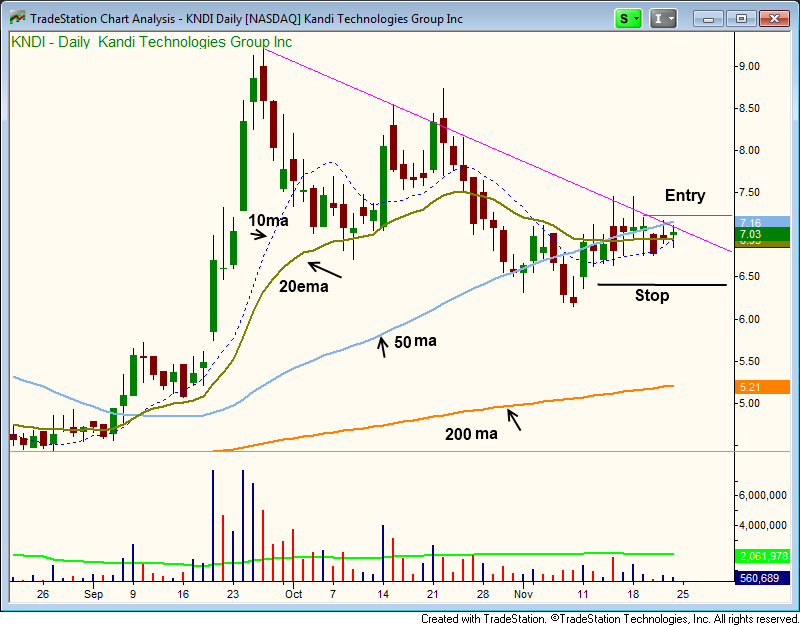
$KNDI is fairly liquid, as it is under $10 but trades a few million shares a day. $RCON and $TMKR average around 250k to 300k volume per day and are not as liquid, so please make sure you are comfortable with the position size you take. However, for most accounts liquidity should not be an issue, especially since we are taking 25% of max size.