ETFs and market commentary:
Stocks slid lower on Friday but on lighter trade. All five major indices fell into the red, with higher beta issues leading the decline. By the closing bell the small-cap Russell 2000 and the S&P MidCap 400 had shed 1.4% and 1.1 % respectively. The Nasdaq shed 0.8%, while both the S&P 500 and the Dow Jones Industrial Average lost 0.7%. Stocks suffered their worst setback of the year.
For the second time in as many days, market internals were mixed. Trade tumbled on the Nasdaq by 17.6% but on the NYSE by a modest 1.6%. Declining volume topped advancing volume by a ratio of 4.2 to 1 on the NYSE and 3.3 to 1 on the Nasdaq. The light volume suggests that institutions are not actively involved in Friday’s selloff.
Despite the poor performance put in by equities on Friday, the light volume was the saving grace of the session. Because of the absence of high volume selling, the market did not realize a distribution day. We’ve continually stated lately that as long as the market avoids distribution days and we continue to see buying into weakness, our bullish stance on the market will remain intact. Friday left us no reason to sway from our bullish bias.
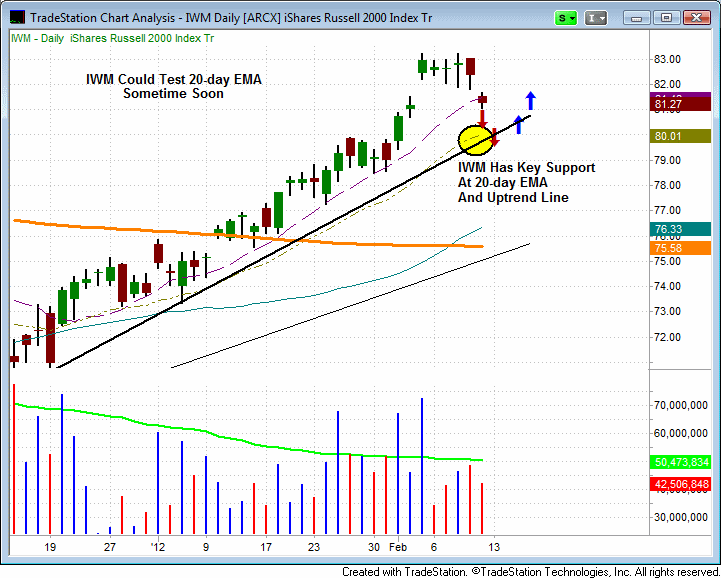
The iShares Russell 2000 Index Trust (IWM) lost support of its 10-day MA on Friday and it now appears that this ETF may rejoin its 20-day EMA for the first time since January 5th of this year. Notice that support of the uptrend line coincides with this key moving average. A pullback, followed by consolidation at this level could provide a buying opportunity in IWM. We are monitoring IWM for a possible long entry.
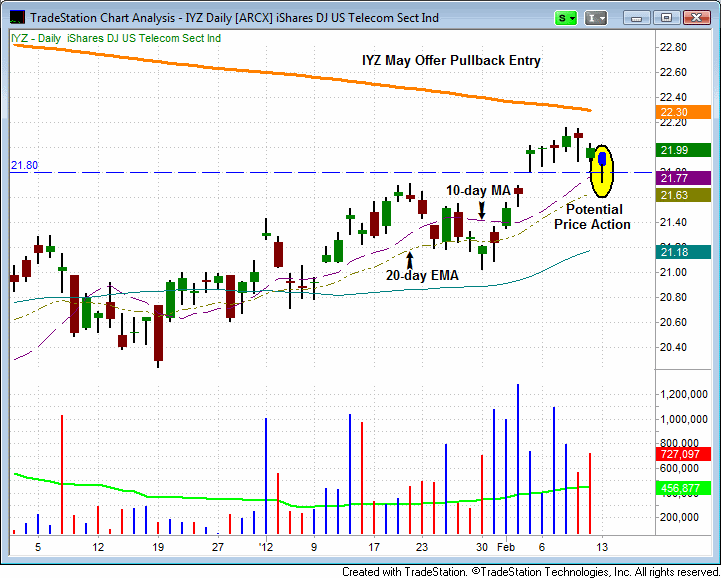
Recently, we exited the iShares Dow Jones US Telecom Sector ETF (IYZ) for a solid profit. Since exiting the trade, IYZ has been consolidating for the past six sessions above its last breakout of $21.70. A retest of this level and/or an undercut of the 10-day/20-day moving averages could present a buying opportunity in this ETF.
On Friday, IYT undercut its 20-day EMA and formed a bullish reversal candle. If Friday’s low holds, IYT is likely prepping for another move higher. DVY has been showing excellent relative strength over the past two sessions, as it has been consolidating above the gap formed on February 2, 2012. DVY is also holding support of its 10-day MA. The market continues to hold up well but we are still may have to withstand a few more days of selling pressure prior to a potential move higher in the market. For the moment, we will likely have to exercise patience, since it may take some time for new setups to develop.
Today’s ETF Watchlist:
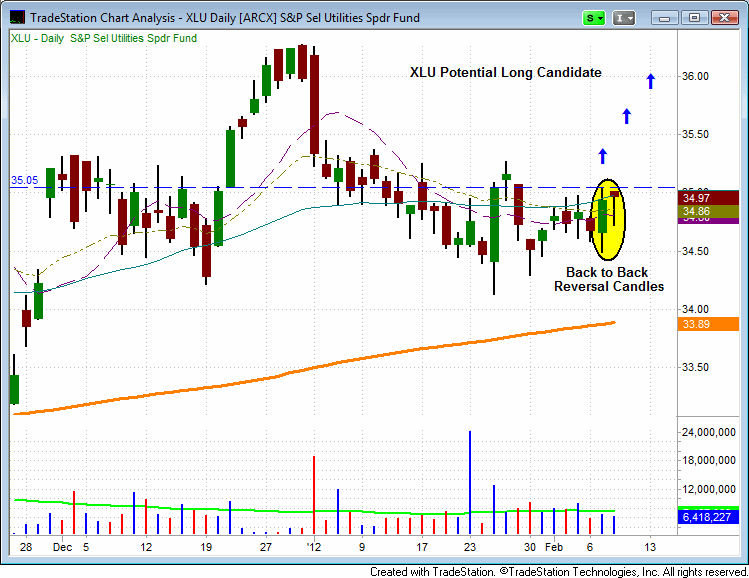
XLU
Long
Shares = 500
Trigger = 35.12
Stop = 34.38
Target = 36.60
Dividend Date = n/a
Notes = See commentary from Feb. 10 report
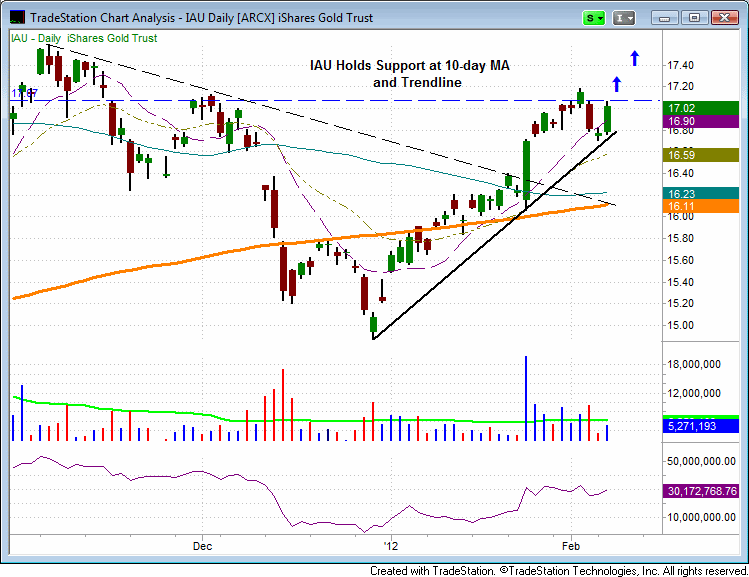
IAU
Long
Shares = 800
Trigger = 17.13
Stop = 16.47
Target = new swing high
Dividend Date = n/a
Notes = See commentary from Feb. 8 report
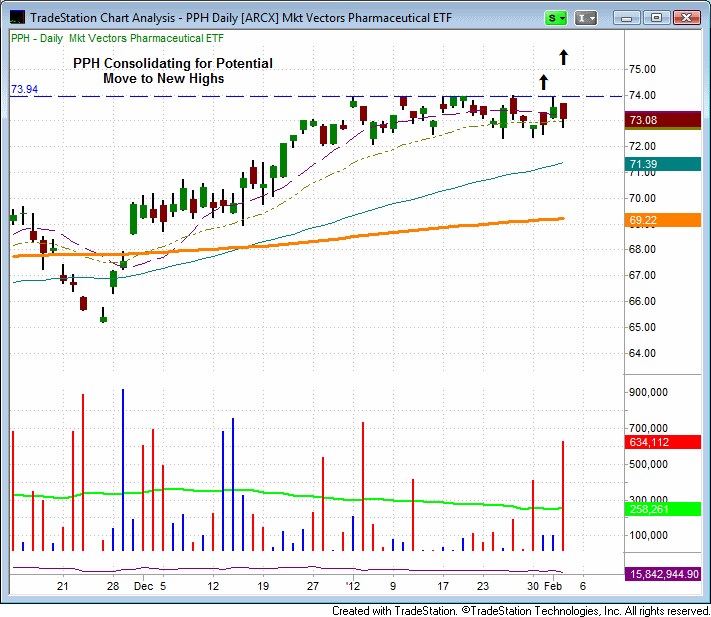
PPH
Long
Shares = 300
Trigger = 74.04
Stop = 72.22
Target = new swing high
Dividend Date = n/a
Notes = We’ve been monitoring this trade for potential entry and it remains on our watchlist.
Daily Performance Report:
Below is an overview of all open positions, as well as a performance report on all positions that were closed only since the previous day’s newsletter. Net P/L figures are based on the $50,000 Wagner Daily model account size. Changes to open positions since the previous report are listed in red text below. Please review the Wagner DailySubscriber Guide for important, automatic rules on trigger and stop prices

Having trouble seeing the position summary graphic above? Click here to view it directly on your Internet browser instead.
Notes:
- No trades were made.
- Reminder to subscribers – Intraday Trade Alerts to your e-mail and/or mobile phone are normally only sent to indicate a CHANGE to the pre-market plan that is detailed in each morning’s Wagner Daily. We sometimes send a courtesy alert just to confirm action that was already detailed in the pre-market newsletter, but this is not always the case. If no alert is received to the contrary, one should always assume we’re honoring all stops and trigger prices listed in each morning’s Wagner Daily. But whenever CHANGES to the pre-market stops or trigger prices are necessary, alerts are sent on an AS-NEEDED basis. Just a reminder of the purpose of Intraday Trade Alerts.
- For those of you whose ISPs occasionally deliver your e-mail with a delay, make sure you’re signed up to receive our free text message alerts sent to your mobile phone. This provides a great way to have redundancy on all Intraday Trade Alerts. Send your request to [email protected] if not already set up for this value-added feature we provide to subscribers.
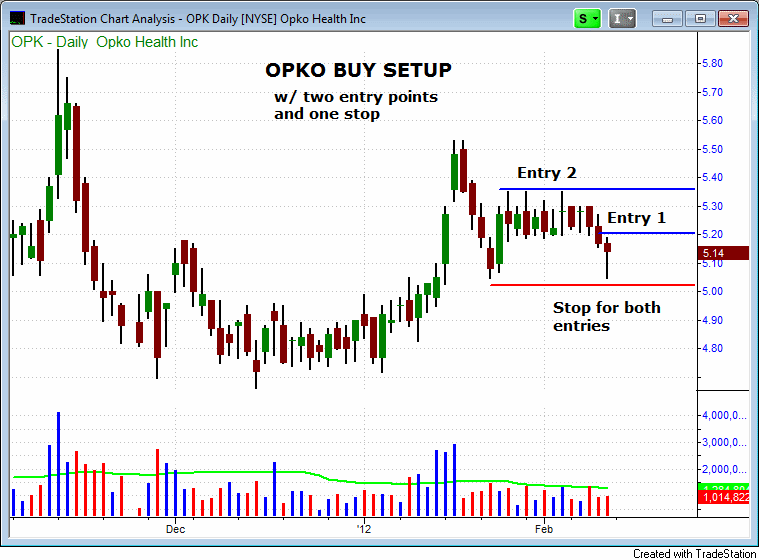
OPK formed a bullish reversal candle on Friday. The setup is detailed in the Stock Watchlist section below:
NOTE: We are changing the name of the Full-Serve watchlist to the “Stock Watchlist” to reduce confusion so that both newsletters use the same terminology. Because of this, we will no longer have a Self-Serve watchlist.

Daily Stock Summary
Below is an overview of all “full-serve” open positions, as well as a performance report on all “full-serve” positions that were closed only since the previous day’s newsletter. Net P/L figures are based on the $50,000 model account size. Changes to open positions since the previous report are listed in red text below.
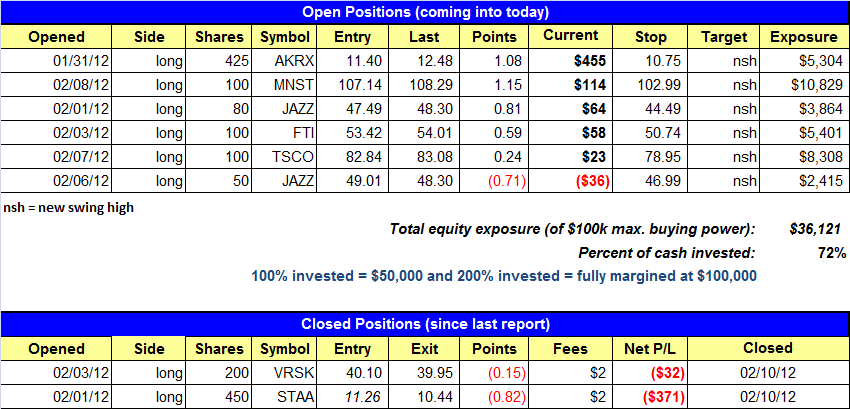
Having trouble seeing the position summary graphic above? Click here to view it directly on your Internet browser instead.
Notes:
- STAA stopped us out of the full position.
- Per intraday alert, stopped out of VRSK for a small loss due to the weak price since our entry.
- Please note the changes to the Stock Watchlist.
Relative Strength Watchlist:
The Relative Strength (or RS) Watchlist makes it easy for subscribers to import data into their own scanning software, such as Tradestation, Interactive Brokers, and TC2000. The list is comprised of the strongest 100 (or so) stocks in the market over the past six to 12 months. The scan is based on the following criteria and is updated every Monday:
- Stock is in a well defined uptrend, trading above both the 50-day and 200-day moving averages, with the 50-day moving average above the 200-day moving average (both moving averages should be in an uptrend as well).
- Today’s close is less than 20% off the 52-week high
- Close is greater than $5.
- Volume is greater than 200,000 shares per day (using a 50-day volume moving average).
Click here to view this week’s Relative Strength Watchlist in excel
Click here to view this week’s Relative Strength Watchlist as a text file
