market timing model:
SELL – Signal generated on the close of July 10 (click here for more details)
today’s watchlist (potential trade entries):

open positions:
Below is an overview of all open positions, as well as a report on all positions that were closed only since the previous day’s newsletter. Net P/L figures are based on two separate $50,000 model portfolios (one for ETFs and one for stocks). Changes to open positions since the previous report are listed in red shaded cells below. Be sure to read the Wagner Daily subscriber guide for important, automatic rules on trade entries and exits.

Having trouble seeing the open positions graphic above? Click here to view it directly on your web browser instead.
closed positions:

Having trouble seeing the closed positions graphic above? Click here to view it directly on your web browser instead.
ETF position notes:
- No trades were made.
stock position notes:
- LNKD stop triggered on remaining half position.
- Please note that we are selling open long positions are market on the open.
ETF and broad market commentary:
In a sharp reversal from early morning strength, stocks got smacked on brisk trade yesterday. All of the major indices closed down on the session. Higher beta issues led the decline with the small-cap Rusell 2000, S&P MidCap 400 and the Nasdaq sliding 1.2%, 1.1% and 1.0% respectively. The S&P 500 dropped 0.8%, while the Dow Jones Industrial Average fell 0.65%.
In a sharp reversal from early morning strength, stocks got smacked on brisk trade yesterday. All of the major indices closed down on the session. Higher beta issues led the decline with the small-cap Rusell 2000, S&P MidCap 400 and the Nasdaq sliding 1.2%, 1.1% and 1.0% respectively. The S&P 500 dropped 0.8%, while the Dow Jones Industrial Average fell 0.65%.
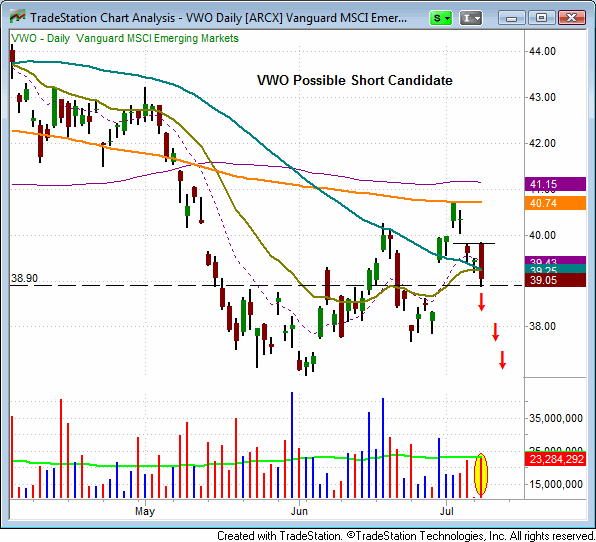
Yesterday, the Vanguard MSCI Emerging Markets ETF (VWO) formed a bearish reversal candle, as it gapped up at the open, but sold off throughout the day, to close near session lows. Further, the selling pressure was accompanied by higher volume and VWO ended the session below support of its 20-day and 50-day moving averages. A move below yesterday’s low of $38.90 could result in a shorting opportunity in this ETF. Trade details are available to our subscribers in the watchlist segment of the newsletter. For those of you trading in qualified accounts, buying EUM above yesterday’s high, would serve as a reasonable proxy for shorting VWO.

Yesterday’s price action was not good for market bulls. Based on the magnitude of the selling, our market timing model has triggered a sell signal. However, we are inclined to trade small position size, since there are numerous support levels that would need to be breached in order for the market to make a significant move lower. These key support levels were discussed in the July 10th issue of The Wagner Daily.
stock commentary:
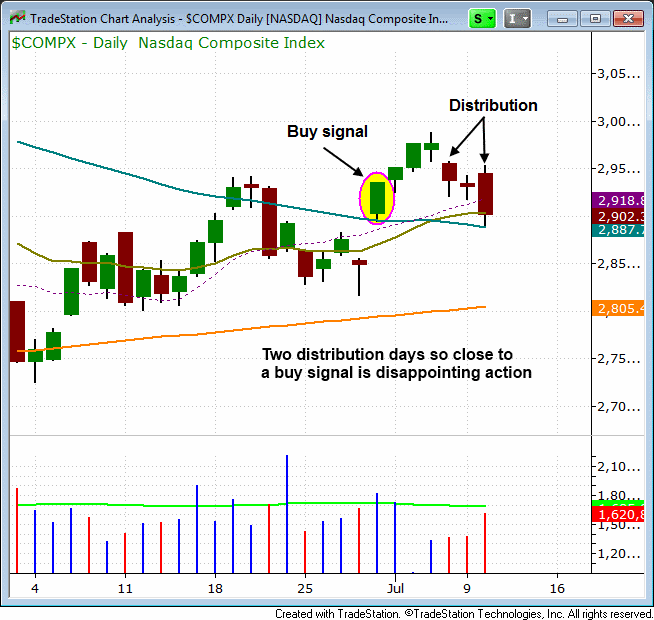
When the market is in a strong multi-month rally it will usually take five or more distribution days to end a rally. However, when the market puts in a fresh buy signal off the lows, one or two days of distribution within a week of the signal is all that is needed to kill the attempted rally. With Tuesday’s heavy volume selling, the Nasdaq has printed two distribution days and forced the timing model back in to sell mode.

Obviously, we would have preferred the market rip higher the past few weeks, but there are some incredibly important lessons to be learned when a rally attempt fails. New subscribers and traders should focus on how we leg in and out of the market on a buy and sell signal when they are so close in time. The management of positions in a tricky market should be 10x more valuable to new subscribers/traders than how we manage a winner in a bull market. A trader must always be digesting market action and willing to go with the flow……doing nothing and staying in hope mode is never the answer. The key is to lose a little when we are wrong and avoid digging too big of a hole so that we are in good shape mentally to catch the next big rally.
Rather than staying in hope mode we are cutting open long positions at market on Wednesday’s open. Stocks like QCOR, SYNC, and DEST are a few examples of healthy stocks getting hit hard. Since there has been very little reward for the risk of being long we feel it’s best to go to cash and wait for conditions to settle down.
If you are a new subscriber, please e-mail [email protected] with any questions regarding our trading strategy, money management, or how to make the most out of this report.
relative strength watchlist:
Our Relative Strength (or RS) Watchlist makes it easy for subscribers to import data into their own scanning software, such as Tradestation, Interactive Brokers, and TC2000. This list is comprised of the strongest 100 (or so) stocks in the market over the past six to 12 months. The scan is updated every Sunday, and this week’s RS Watchlist can be downloaded by logging in to the Members Area of our web site.