market timing model:
Neutral – Signal generated on the close of October 5 (click here for more details)
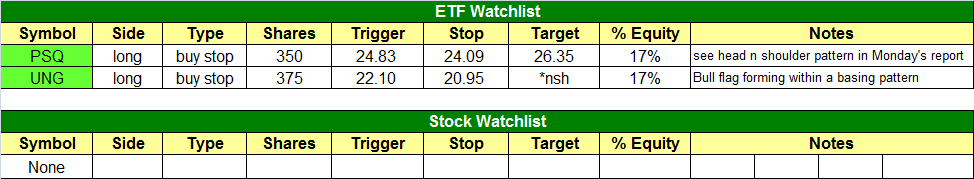
today’s watchlist (potential trade entries):
Having trouble seeing the open positions graphic above? Click here to view it directly on your web browser instead.
open positions:
Below is an overview of all open positions, as well as a report on all positions that were closed only since the previous day’s newsletter. Net P/L figures are based on two separate $50,000 model portfolios (one for ETFs and one for stocks). Changes to open positions since the previous report are listed in pink shaded cells below. Be sure to read the Wagner Daily subscriber guide for important, automatic rules on trade entries and exits.

Having trouble seeing the open positions graphic above? Click here to view it directly on your web browser instead.
closed positions:

Having trouble seeing the closed positions graphic above? Click here to view it directly on your web browser instead.
ETF position notes:
- EPHE stop triggered and we are out with a $400 gain. AMLP stop triggered for a small gain of $100. EEM stopped out for a smaller than average loss. GXG hit our stop for half the position. Note that GXG is listed twice in the open positions section, as we plan to cut more of the position if it is unable to hold above the 20-day EMA.
stock position notes:
- Sold ARRY on the open for a small loss.
ETF and broad market commentary:
Following through on last Friday’s week intraday price action, stocks gapped lower yesterday morning, then drifted in a tight, sideways range throughout the entire day. The Dow Jones Industrial Average ($DJIA) slipped 0.2%, the S&P 500 Index ($SPX) lost 0.4%, and the Nasdaq Composite fell 0.8%. The small-cap Russell 2000 Index ($RUT) and S&P MidCap 400 Index ($MID) declined 0.5% and 0.3% respectively. Showing apathy into the close, the main stock market indexes settled near the middle of their intraday trading ranges.
One positive element of yesterday’s trading session is that turnover was lethargic across the board. Turnover in the NYSE was 21% lighter than the previous day’s level, while trade in the Nasdaq limped in 26% percent lighter. In both exchanges, volume printed its lightest one-day levels since August 30 of this year. With quarterly corporate earnings season starting to heat up, it makes sense that heavy institutional players would be sitting on the sidelines for now, waiting to see the stock market’s initial reaction to the first batch of important earnings reports.
Last week, on October 2, we locked in an 11% gain on a trade in US Natural Gas Fund ($UNG), a commodity ETF designed to roughly track the price of natural gas futures contracts. As you may recall, we sold the ETF into strength as it came within pennies of our original upside price target. In the following day’s ETF commentary, we said we would be looking for a potential, low-risk re-entry buy point into UNG. Specifically, we said, “Even though we have closed this trade, UNG could still move much higher in the intermediate-term. The rally over the past week was a breakout above a valid base of consolidation, which could set into motion a new intermediate-term uptrend for this ETF. As such, UNG is now on our radar screen for potential re-entry after it either pulls back or forms a bull flag chart pattern. There is a good chance we will be able to re-enter the trade at a slightly lower price, or possibly near the current price, but with a more positive reward to risk ratio after UNG undergoes at least a near-term correction.”
Since then, UNG has indeed formed a bull flag on its daily chart. As such, we are now listing it in the ETF watchlist section of today’s newsletter as a potential swing trade re-entry. Since it is a commodity ETF, it’s a bonus that this ETF has a low correlation to the direction of the main stock market indexes, which may be headed lower in the near-term. Subscribers should note our exact buy trigger, stop, and target prices for this trade setup above. Below, we have annotated the bull flag chart pattern that we were anticipating to subsequently develop after exiting the trade on October 2:

After several months of being in “confirmed buy” mode, our market timing model just shifted to “neutral” at the close of trading on October 5 (last Friday). In addition to a few proprietary signals generated by our strategy that led to this change, we discussed in yesterday’s commentary five different technical reasons for the shift away from our prior bullish stance. So, now that we are in “neutral” mode, the rules of our system allow us to assume light bullish or bearish exposure (through short selling and/or buying inverse ETFs). A heavy cash position is common and acceptable when our market timing model is in “neutral” mode as well.
In addition to the UNG trade setup, we have also added $PSQ, an inverse ETF that trades in the opposite direction of the popular Nasdaq 100 Index ($QQQ), as a potential swing trade buy setup. Although $QID is the ticker symbol for the inverse and leveraged flavor of QQQ, we usually avoid the leveraged versions of inverse ETFs whenever there are non-leveraged versions available for trading. We discussed the trade setup for this $PSQ buy setup through our analysis of the bearish “head and shoulders” formation we highlighted in QQQ yesterday. Just to refresh your mind, below is a snapshot of the same QQQ chart pattern we showed you in our October 8 newsletter:

As with UNG, subscribers should note our detailed entry, exit, and stop prices for the $PSQ trade setup in the ETF watchlist section above. Though the trade setup is to potentially buy PSQ, note that we are basing our entry and exit signals for this swing trade setup on the price action of QQQ instead. This is because a non-inverse ETF typically tracks more closely to the underlying index (due to the lack of derivatives on which an inverse ETF is based). Traders with marginable accounts could simply sell short QQQ, rather than buying PSQ (only if PSQ triggers). Further, traders with small accounts might consider buying the leveraged version of PSQ, which is QID. However, the “official” trade that will be tracked and reported is PSQ long (not QQQ short or QID long). Finally, notice that our share size is reduced so that we are risking only about 50% of our normal risk on this trade (full risk is approximately 1% of the model ETF trading portfolio account value).
We will conclude today’s broad market and ETF commentary by reiterating that our market bias has not suddenly become heavily bearish. With the main stock market indexes still trading above their 50-day moving averages, and relatively near their 52-week highs, it is way too early and risky to become aggressive on the short side of the market. Nevertheless, for the detailed reasons we outlined in yesterday’s newsletter, the long side of the market is looking less and less encouraging as well. This is why, of course, our stock market timing model is now in “neutral” mode, which enables us to be lightly positioned on either side of the market, heavily in cash, or in ETFs with low correlation to the direction of the broad market.
stock commentary:
PCRX is one of just a few potential long setups we found last night. It is consolidating in a tight range near the highs and may offer us a low risk buy entry late this week or early next week…. IF the market cooperates (this is not an official setup).

We’ll continue to lay low on the long side with tight stops on existing positions. We do not mind waiting for conditions and setups to improve, and if/when they do we will dive back in to the market . Just how much exposure we take on will depend on the quality of the setups.
If you are a new subscriber, please e-mail [email protected] with any questions regarding our trading strategy, money management, or how to make the most out of this report.
relative strength combo watchlist:
Our Relative Strength Combo Watchlist makes it easy for subscribers to import data into their own scanning software, such as Tradestation, Interactive Brokers, and TC2000. This list is comprised of the strongest stocks (technically and fundamentally) in the market over the past six to 12 months. The scan is updated every Sunday, and this week’s RS Combo Watchlist can be downloaded by logging in to the Members Area of our web site.