market timing model:
SELL – Signal generated on the close of July 10 (click here for more details)
today’s watchlist (potential trade entries):

open positions:
Below is an overview of all open positions, as well as a report on all positions that were closed only since the previous day’s newsletter. Net P/L figures are based on two separate $50,000 model portfolios (one for ETFs and one for stocks). Changes to open positions since the previous report are listed in red shaded cells below. Be sure to read the Wagner Daily subscriber guide for important, automatic rules on trade entries and exits.
Having trouble seeing the open positions graphic above? Click here to view it directly on your web browser instead.
closed positions:

Having trouble seeing the closed positions graphic above? Click here to view it directly on your web browser instead.
ETF position notes:
- No trades were made.
stock position notes:
- Sold LNKD on the open for a small loss. The total loss on the full 50 share position was -$160.
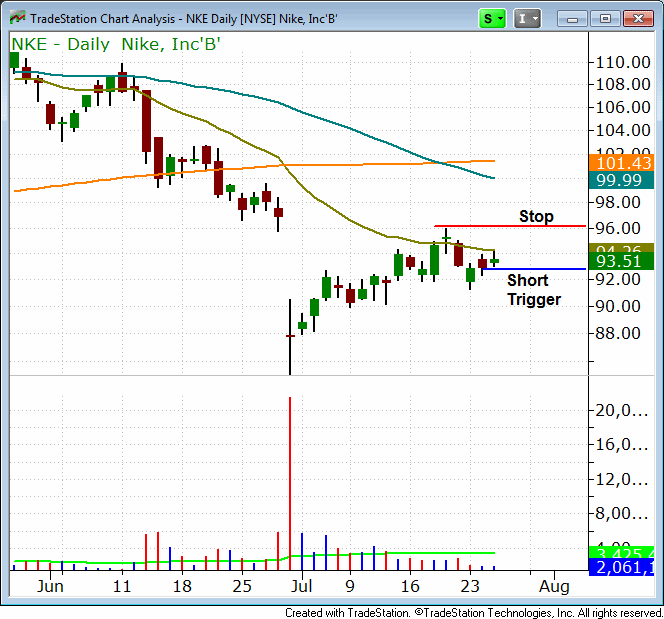
- Removed CDE from the watchlist and replaced with NKE.
ETF and broad market commentary:
After seeing positive territory for much of the day, stocks came under late day pressure to close mixed. Trade was also mixed. The Dow Jones Industrial Average, small-cap Russell 2000 and the S&P MidCap 400 ended the session up by 0.5%, 0.2% and 0.1% respectively. The day’s worst performer, the Nasdaq, ended the day down by just over 0.3%. The S&P 500 closed fractionally lower.
Market internals ended the day on a mixed note. Volume increased on the Nasdaq by 1.3% but fell on the NYSE by 2.7%. Advancing volume ended at par with declining volume on the NYSE, while on the Nasdaq, advancing volume outpaced declining volume by a factor of 1.4 to1. Despite the fact that the Nasdaq closed lower on the session, it is interesting to note that advancing volume topped declining volume on the day.
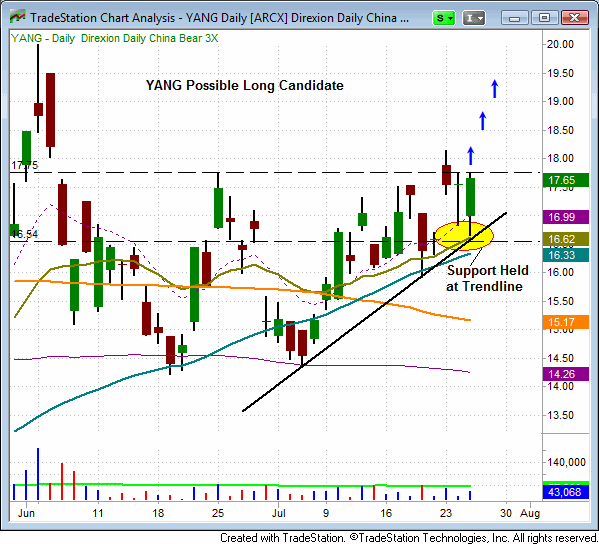
Yesterday, on an uptick in volume, the Direxion Daily China Bear 3x ETF (YANG) formed a bullish engulfing candle, as it gapped down, held support of its trendline and the 20-day EMA, and reversed to close at session highs. Further, it marked the second consecutive day that YANG formed a bullish reversal candle. A volume propelled move above the two day high of $17.75 could present a buy entry trigger in this ETF. We are placing YANG on the watchlist. Trade details are available to our subscribers in the watchlist section of the newsletter.
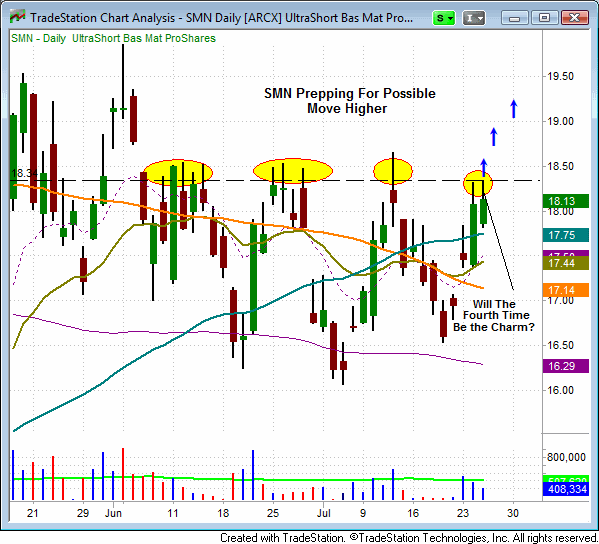
Since Early June of this year, the ProShares UltraShort Basic Materials ETF (SMN) has made three attempts to break above resistance near $18.50. Over the past two sessions, this ETF has attempted to crack above this level for the fourth time. With each touch of a resistance level, the odds increase that the level will be broken. If SMN can find its way above this key mark on a burst of volume, this fourth test of this level could be what is needed to propel SMN to a fresh six month high.
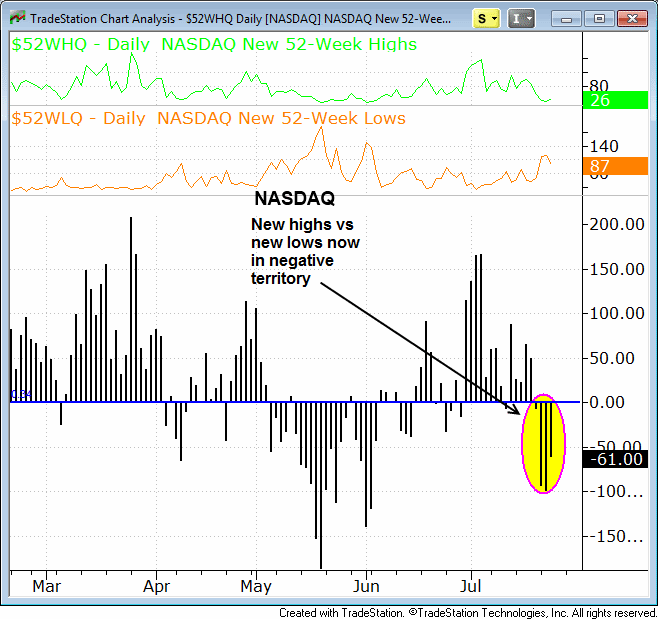
The market managed to gain some footing yesterday, but the poor price action into the close points to continued weakness. Technically, we could claim a distribution day for the Nasdaq, but the higher advancing volume on this exchange puts into question the conviction behind the selling. Still, the market is showing few signs of recovering any time soon.
stock commentary:
We sold the remaining half position of LNKD for a small loss yesterday on the open. We added one new short setup in NKE and canceled CDE.
Although the Nasdaq Composite has held up around support of the 50-day MA the past few days, the action in leadership stocks suggests that support will not hold much longer. PCLN, AAPL, ISRG, BWLD, ULTA, WFM, TRIP, WIFI, VHC, VVUS, EAT, TDG, AVD, and GET have all broken down below the 50-day MA, with some of the selling action quite violent. In terms of breadth, Nasdaq New Highs vs New Lows is also deteriorating:
NKE is an official short setup beneath Wednesday’s low. The entry is based off the 7/19 stalling action as NKE probed above the 20-day EMA.
If you are a new subscriber, please e-mail [email protected] with any questions regarding our trading strategy, money management, or how to make the most out of this report.
relative strength watchlist:
Our Relative Strength (or RS) Watchlist makes it easy for subscribers to import data into their own scanning software, such as Tradestation, Interactive Brokers, and TC2000. This list is comprised of the strongest 100 (or so) stocks in the market over the past six to 12 months. The scan is updated every Sunday, and this week’s RS Watchlist can be downloaded by logging in to the Members Area of our web site.