today’s watchlist (potential trade entries):

open positions:
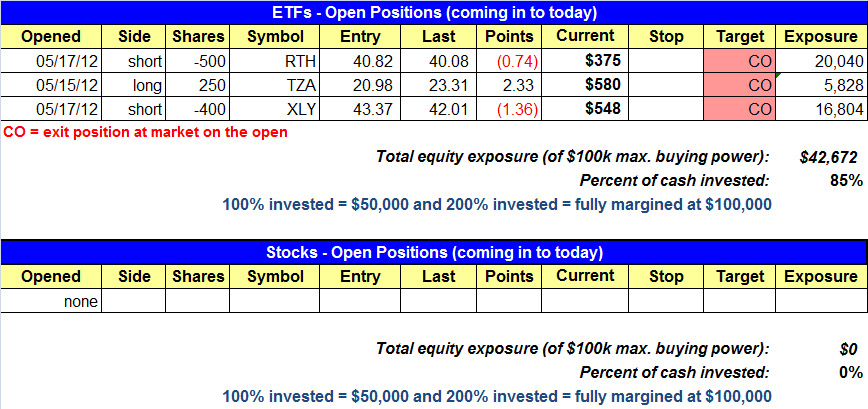
Below is an overview of all open positions, as well as a report on all positions that were closed only since the previous day’s newsletter. Net P/L figures are based on two separate $50,000 model portfolios (one for ETFs and one for stocks). Changes to open positions since the previous report are listed in a pink shaded cell below. New entries are shaded in green cells. Be sure to read the Wagner Daily subscriber guide for important, automatic rules on trade entries and exits.

Having trouble seeing the open positions graphic above? Click here to view it directly on your web browser instead.
closed positions:

Having trouble seeing the closed positions graphic above? Click here to view it directly on your web browser instead.
ETF position notes:
- We are exiting all open positions at market on the open.
stock position notes:
- Sold BRCM at market on the open to lock in a gain. BRJI hit its target last Friday into the close.
ETF and broad market commentary:
Stocks were hit hard for a fifth consecutive day on Friday on a big spike in trade. Friday ended the worst week of the year for the market. Both the Nasdaq and the S&P MidCap 400 slumped 1.2%, while the small-cap Russell 2000 dropped 1.0%. The S&P 500 and the Dow Jones Industrial Average fared slightly better than the higher-beta indices, as they slid 0.7% and 0.6% respectively.
For the fourth day in a row, market internals remained in a bearish spiral. Volume jumped on the Nasdaq by 30.0% and on the NYSE by 22.9%. However, Friday’s higher volume was in large part due to options expiration. Declining volume outpaced advancing volume on the NYSE and the Nasdaq by factors of 2.4 to 1 and 1.6 to 1 respectively.
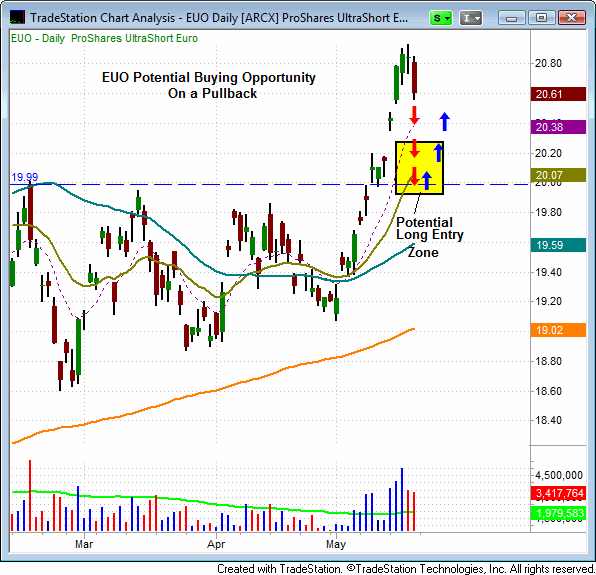
On May 9th, the ProShares UltraShort Euro ETF (EUO) rallied above key resistance at $20.00. Since then, EUO set a new swing high near $21.00 and on Friday began showing signs of weakness as it sold off for the first time in nearly three weeks. EUO may offer a buying opportunity on a pullback near its 20-day EMA. Ideally, we would like to see EUO form a reversal candle near this key mark, as this would offer a possible pivot point to open a long position. We will continue to monitor EUO for a possible entry.

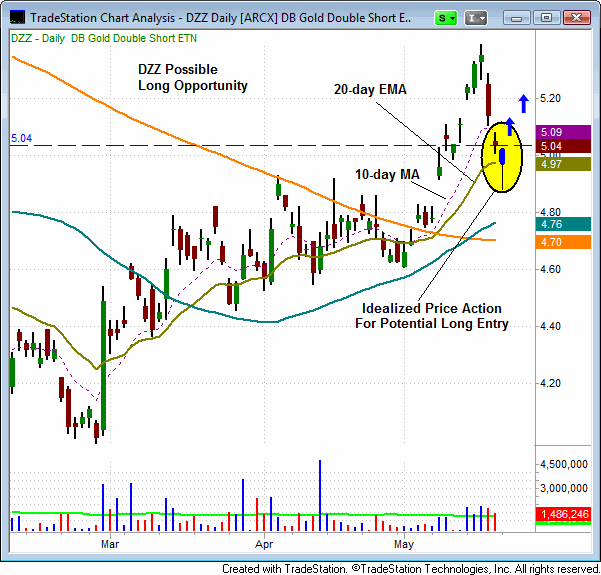
Over the past two sessions, the DB Double Gold Short ETN (DZZ) has pulled back off its recent highs. On Friday, DZZ lost support of its 10-day MA and now appears headed for support of the 20-day EMA. An undercut of the 20-day EMA and the formation of a reversal candle could present a buying opportunity in DZZ.

Our inverse and short positions are rapidly approaching their targets. Given the precipitous decline in the market, we will be closing all of our short positions (RTH, TZA and XLY) at the open on Monday. All of the major indices are at or near key support of their respective 200-day moving averages. Since we are very close to major support in the broad market, we are not interested in taking on new short positions. Further, since we are in an established downtrend, we are not inclined to play the long side of the market either. Instead, as long as our market timing model continues to provide a sell signal, we will be looking to establish new short positions when the market rebounds. It is now time to be patient in the market. Opening new trades at the current levels involves taking on too much risk with minimal upside potential.
stock commentary:
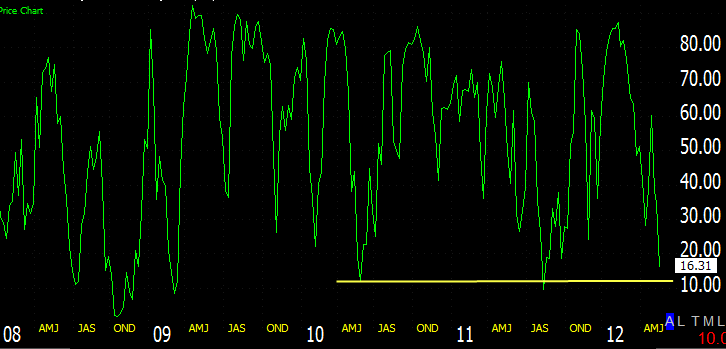
The weekly chart below shows the percentage of stocks trading above the 40-day moving average (this is a built-in indicator on the Telechart 2000 platform). The percentage of stocks above the 40ma is approaching the extreme 8-12% level that we have seen during major selloffs over the past three years. This indicator is not used for market timing, as it usually leads a market bottom by several weeks or more. However, it does a good job of defining where the market is in terms of breadth. Once the market reaches an extreme level it can then begin to repair itself over the next few months.

Along with indicator above, both the NYSE and Nasdaq McClellan Oscillator are in deeply oversold territory. Again, this is not a market timing tool but with many indicators and stocks at extremely oversold levels we must be prepared for a sharp reversal to the upside. The short-term plan is to avoid new short positions and wait for a decent bounce in the market. Whether that bounce will lead to quality short setups we do not know, but that is why we take the market one day at a time and shy away from bold predictions.
If you are a new subscriber, please e-mail [email protected] with any questions regarding our trading strategy, money management, or how to make the most out of this report.