Commentary:
US equities closed down on Monday on mixed trade. All five major indices ended the day in the red. The small-cap Russell 2000 realized the biggest loss as it fell just over 1.1%. The S&P MidCap 400 shed 0.8% while the Dow Jones Industrial Average fell 0.7%. Both the Nasdaq and the S&P 500 dropped 0.6% yesterday.
Market internals ended the session mixed for a second consecutive day. Volume fell by 3.4% on the Nasdaq but rose by 3.9% on the NYSE. However, declining volume outpaced advancing volume on both exchanges. By the closing bell the spread ratio stood at 3.5 to 1 on the NYSE and 1.9 to 1 on the Nasdaq in favor of down volume. The combination of higher total volume and higher declining volume suggest that institutions were actively involved in Monday’s selling activity on the NYSE. However the light volume on the Nasdaq eliminates the possibility of distribution on the tech rich index.
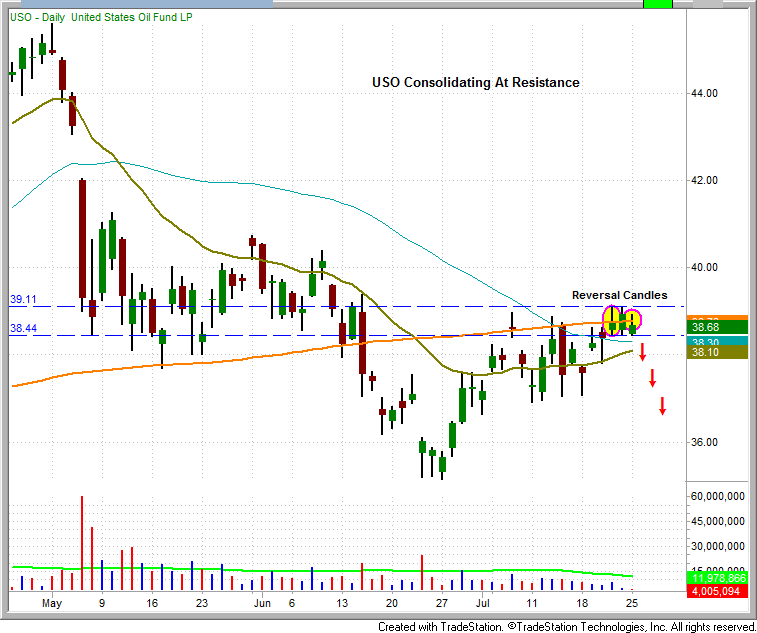
Since finding its footing in late June the United States Oil Fund ETF (USO) has spent the last three sessions consolidating at resistance near the 200-day MA. In this timeframe USO has formed two distinct reversal candles as it has probed above the 200-day MA. A move below the three day low of $38.46 may provide a short entry trigger for this ETF.

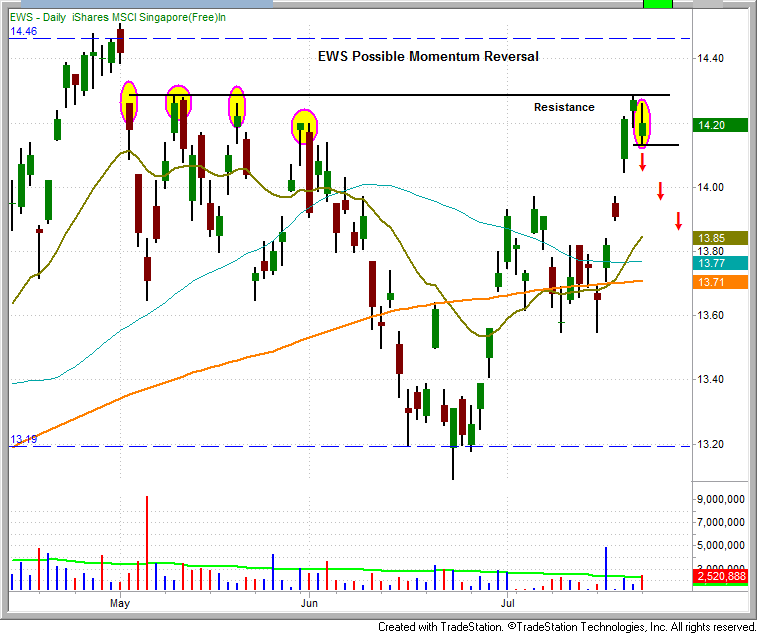
Since undercutting its 200-day MA six days ago, the iShares MSCI Singapore Index Fund ETF (EWS) has quickly rallied back into key resistance at $14.29. A volume assisted move back below yesterday’s low of $14.14 could provide a shorting opportunity in this ETF. Since EWS is in a long term uptrend this trade involves higher risk and if entered would only be intended as a two or three day reversal play.

Given the stalemate in Washington it is somewhat surprising how resilient the market was on Monday. However, similar to Friday’s action, Monday’s trade also seemed to be mired in confusion. Markets don’t like uncertainty and until the budget, debt and deficit matters are resolved we expect more of the same in the coming days. Again, we recommend caution as Congress tip toes its way forward.
Today’s Watchlist:

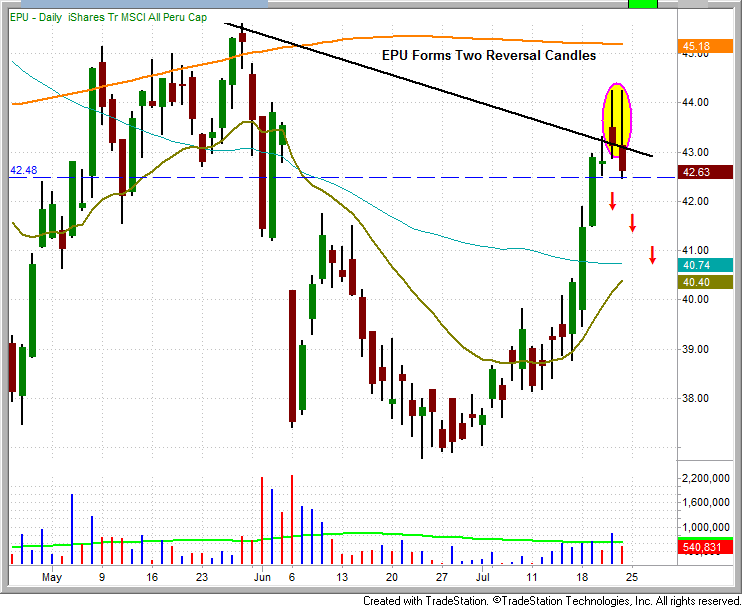
EPU
Short
Shares = 200
Trigger = 42.39
Stop = 44.43
Target = Previous swing low
Dividend Date = n/a
Notes = See commentary from July 25 report
Daily Performance Report:
Below is an overview of all open positions, as well as a performance report on all positions that were closed only since the previous day’s newsletter. Net P/L figures are based on the $50,000 Wagner Daily model account size. Changes to open positions since the previous report are listed in red text below. Please review the Wagner Daily Subscriber Guide for important, automatic rules on trigger and stop prices
- No changes were made to open positions.
- Reminder to subscribers – Intraday Trade Alerts to your e-mail and/or mobile phone are normally only sent to indicate a CHANGE to the pre-market plan that is detailed in each morning’s Wagner Daily. We sometimes send a courtesy alert just to confirm action that was already detailed in the pre-market newsletter, but this is not always the case. If no alert is received to the contrary, one should always assume we’re honoring all stops and trigger prices listed in each morning’s Wagner Daily. But whenever CHANGES to the pre-market stops or trigger prices are necessary, alerts are sent on an AS-NEEDED basis. Just a reminder of the purpose of Intraday Trade Alerts.
- For those of you whose ISPs occasionally deliver your e-mail with a delay, make sure you’re signed up to receive our free text message alerts sent to your mobile phone. This provides a great way to have redundancy on all Intraday Trade Alerts. Send your request to [email protected] if not already set up for this value-added feature we provide to subscribers.

Having trouble seeing the position summary graphic above?
Click here to view it directly on your Internet browser instead.
Notes:
Edited by Deron Wagner,
MTG Founder and
Head Trader