market timing model:
Sell – Signal generated on the close of October 12 (click here for more details)
today’s watchlist (potential trade entries):
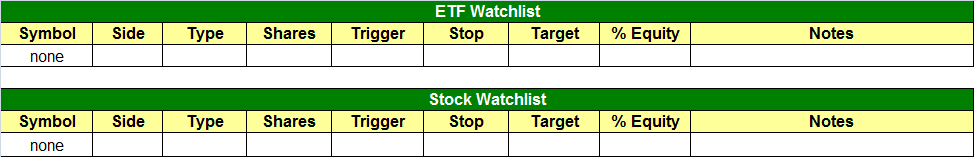
Having trouble seeing the open positions graphic above? Click here to view it directly on your web browser instead.
open positions:
Below is an overview of all open positions, as well as a report on all positions that were closed only since the previous day’s newsletter. Net P/L figures are based on two separate $50,000 model portfolios (one for ETFs and one for stocks). Changes to open positions since the previous report are listed in pink shaded cells below. Be sure to read the Wagner Daily subscriber guide for important, automatic rules on trade entries and exits.
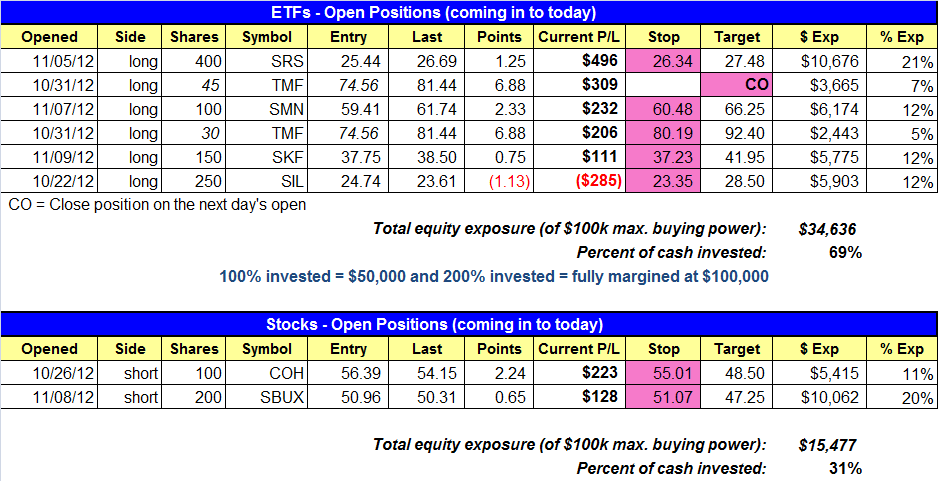
Having trouble seeing the open positions graphic above? Click here to view it directly on your web browser instead.
closed positions:

Having trouble seeing the closed positions graphic above? Click here to view it directly on your web browser instead.
ETF position notes:
- UNG buy setup was cancelled because the open was more than 1.3% above the trigger.
stock position notes:
- No trades were made.
ETF and broad market commentary:
Yesterday was a tug-of-war between the bulls and bears that resulted with the bears once again getting the upper hand by the closing bell. Stocks gapped lower on the open, reversed and rallied to substantial gains by mid-day, but once again sold off in the afternoon to close near their opening lows. With the exception of the S&P Midcap 400 Index ($MID), the major indices fell between 0.4% to 0.7%. The S&P Midcap 400 showed a bit of relative strength by only losing 0.3%. It is also the only index still (barely) holding support of its 200-day moving average.
Turnover soared across the board, as total volume in the NYSE jumped a whopping 136% above the previous day’s level. However, bear in mind that volume declined more than 60% in the previous day’s session. Total volume in the Nasdaq rose 30%. Banks, mutual funds, hedge funds, and other institutions were clearly active participants in yesterday session. The sharp morning rally, followed by the equally substantial afternoon decline, most likely caused a lot of juxtaposition and activity amongst the big money players.
Although our market timing model remains in “sell” mode, and our focus remains on the short side of the market, it’s never a bad idea to keep an eye on ETFs and stocks that are exhibiting relative strength to the broad market, as these will be the first equities to move higher when the broad market eventually finds support and bounces.
One of the very few ETFs that meets this criteria is iShares Xinhua China 25 Index Fund ETF ($FXI). Although the main stock market indexes of the USA have been in a downtrend since mid-September, FXI actually started trending higher right as the domestic markets started selling off. But despite its relative strength, FXI began correcting last week, and is now in pullback mode. However, this is an ETF to consider buying if the stock market suddenly surprises us with a confirmed buy signal. Looking at the daily chart of FXI below, notice that FXI pulled back yesterday to close right at support of its 200 day moving average, following an extended run up from its October breakout:

At the present time, we are not looking at buying FXI because the domestic broad market has yet to put in a convincing near-term bottom. Still, this ETF should be on your watchlist as one of the first ETFs to consider buying when stocks eventually find a bottom. Therefore, it has been added to our internal watchlist as a potential long candidate if our market timing model shifts back into “neutral” or “buy” mode.
Yesterday, we said there were two ETFs on our watchlist for potential short entry if they managed to bounce into resistance levels that would provide us with low-risk short selling entry points. One of those ETFs was PowerShares QQQ Trust ($QQQ), which we analyzed two days ago. The other ETF was iShares Nasdaq Biotechnology Index Fund ($IBB). Take a look at its current chart pattern:

Although IBB was a market leader throughout most of 2012, it very quickly began showing relative weakness and became a loss leader after the ETF began correcting in early October. Now, it is bouncing off support of its 200-day moving average, and we’re hoping it will have enough bullish momentum in the coming days for it to probe above resistance of its 20-day exponential moving average, and to near resistance of its 50-day moving average. If it does, it will present us with an ideal, low-risk short selling entry point, in anticipation of another move down to at least re-test the prior lows of a few days ago. IBB is not yet on our watchlist as an “official” short entry, but we are monitoring its price action and will alert you to a potential short sale entry point if it provides us with a proper, low-risk trade setup.
High volatility and intraday indecision, such as was exhibited in yesterday’s broad market action, can be nerve-racking and frustrating for short-term swing traders. However, there is one benefit to such price action. Since stocks formed a similar pattern (morning strength followed by afternoon weakness) on November 9, we now have two failed intraday rally attempts within the past three days. The benefit of this is that it makes it easy to adjust protective stop prices on short positions because if the main stock market indexes manage to rally above their three-day highs, bullish momentum will probably move stocks substantially higher in the near-term.
Because of the price action described above, we have trailed most of the protective stops tighter on our ETF positions much tighter, generally to just below yesterday’s lows. In the case of the inverse ETFs, this would basically correlate to breakouts above yesterday’s highs in the major indices.Presently, our model trading portfolio is showing an unrealized gain of approximately $1,100 (just over a 2% portfolio gain based on the $50,000 model account value).
Now that we have trailed stops higher, we should still be able to lock in substantial gains with our ETF trades, even if the major indices suddenly jump back above their three-day highs. Nevertheless, the weak action of the past three days means there is equally a chance that stocks could now tumble to new lows, due to the back to back failed reversal attempts (including the November 12 “inside day”). If that happens, our existing short and inverse ETF positions would realize substantially larger gains, and we would then immediately trail the protective stops even tighter, or look to take profits, the following day.
Going into yesterday, we were stalking US Natural Gas Fund ETF ($UNG) as a potential buy entry if it rallied above the high of the previous two days. Soaring nearly 5% higher in yesterday’s session, UNG indeed moved above the two-day high (as we anticipated). However, since the ETF opened more than 1.3% above our trigger price, our clearly-defined trading rules (listed in the Wagner Daily subscriber guide caused us to cancel the buy setup as an “official” buy entry. Good trade setups sometimes gap sharply higher on the open (most of yesterday’s gain in UNG was the result of the opening gap), which is bullish price action. However, the required stop price when this happens significantly diminishes our reward to risk ratio on the setup. Therefore, we passed on buying UNG yesterday. Nevertheless, we still may get a secondary entry point if the ETF gives us a pullback to near our originally anticipated entry point.
stock commentary:
We lowered the stop on both short positions in case the broad market averages break above Tuesday’s high. In $COH, we decided to go with a very tight stop as we do not want the price action to return back above the 20-period EMA on the hourly chart:

It is concerning that the market has been unable to bounce at all from deeply oversold levels the past few days, as this type of action can lead to capitulation. A capitulation day is when the market is down a large amount with every industry group down as well…there is nowhere to hide…investors just want out! This action is ideal for covering short positions into weakness.
If you are a new subscriber, please e-mail [email protected] with any questions regarding our trading strategy, money management, or how to make the most out of this report.
relative strength combo watchlist:
Our Relative Strength Combo Watchlist makes it easy for subscribers to import data into their own scanning software, such as Tradestation, Interactive Brokers, and TC2000. This list is comprised of the strongest stocks (technically and fundamentally) in the market over the past six to 12 months. The scan is updated every Sunday, and this week’s RS Combo Watchlist can be downloaded by logging in to the Members Area of our web site.