Buy Mode
– Timing model generated buy signal on close of March 5 (click here for more details)
today’s watchlist (potential trade entries):

Having trouble seeing the open positions graphic above? Click here to view it directly on your web browser instead.
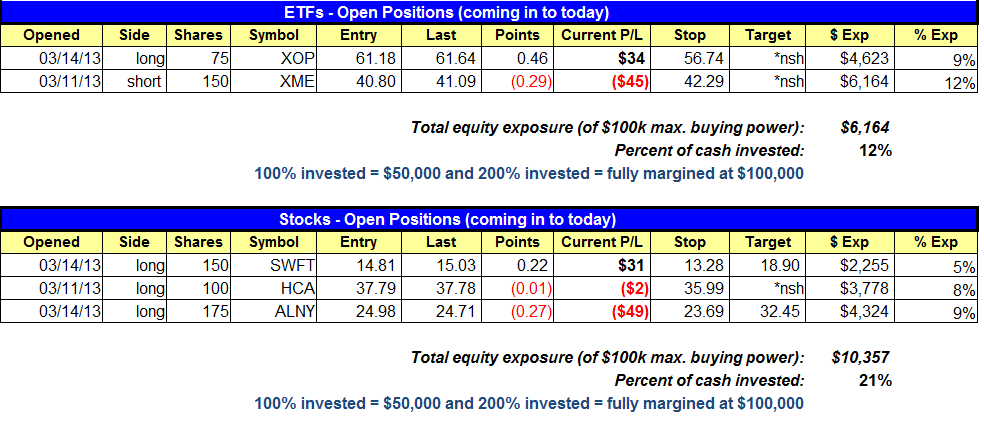
open positions:
Below is an overview of all open positions, as well as a report on all positions that were closed only since the previous day’s newsletter. Net P/L figures are based on two separate $50,000 model portfolios (one for ETFs and one for stocks). Changes to open positions since the previous report are listed in pink shaded cells below. Be sure to read the Wagner Daily subscriber guide for important, automatic rules on trade entries and exits.

Having trouble seeing the open positions graphic above? Click here to view it directly on your web browser instead.
closed positions:

Having trouble seeing the closed positions graphic above? Click here to view it directly on your web browser instead.
ETF position notes:
- No trades were made.
stock position notes:
- No trades were made.
ETF, stock, and broad market commentary:
Stocks gapped lower across the board Monday morning in reaction to Eurozone/Cyprus news. Despite the ugly open, stocks held up immediately and pushed higher most of the day before selling off during the final 90 minutes of trading. Although stocks retreated into the close, the main averages did manage to close well off the lows of the session. Stocks closed 0.5% lower on average, but volume was lighter on both exchanges, which means that the S&P 500 and NASDAQ both avoided distribution.
Our long position in $XOP held up well yesterday closing above 61.00. The 10-day moving average is catching up quickly and should provide support within the next few days. On the short side, $XME once again stalled at resistance from the 20-day EMA and backed off. A break of Monday’s low would put the price action below all the major averages on the intraday and daily charts.
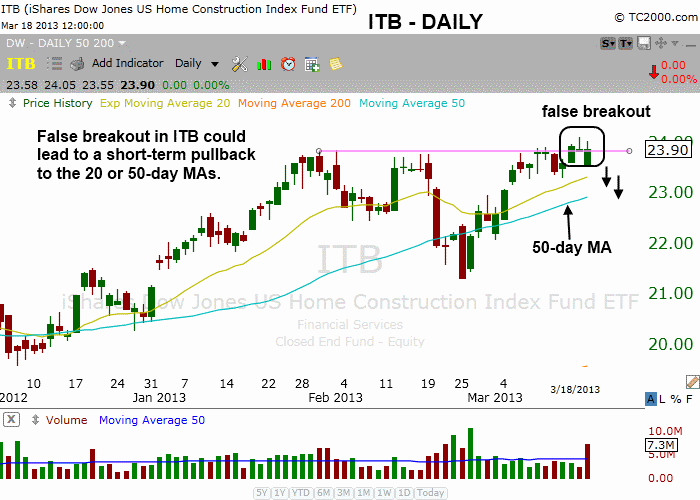
After a false breakout attempt above 23.93 late last week, the iShares Dow Jones US Home Construction ($ITB) recovered nicely off the 10-day moving average on Monday. Although we would prefer a two to five bar pullback to the 20-day or 50-day moving average as a low risk entry, $ITB could simply trade in a tight range and attempt to breakout again within the next few days. A short-term pullback would help to work off the V-shaped basing pattern formed by the sharp selloff from 2/20 to 2/25 and quick recovery from 2/26 to 3/6.

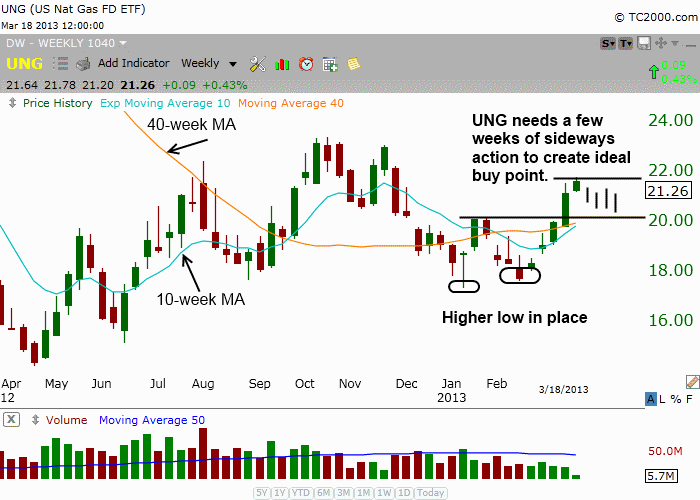
United States Natural Gas Fund ($UNG) has improved techncially the the past six weeks by setting a higher low on the weekly chart and clearing the prior high at 20.20.

The 10-week moving average is now sloping higher and should eventually cross above the 40-week MA while $UNG forms the right side of its base. After a prolonged downtrend, the 10-week MA crossing above the 40-week MA is bullish, trend reversal signal. We would like to see $UNG chop around for a few weeks to create a low risk entry point and stop level.
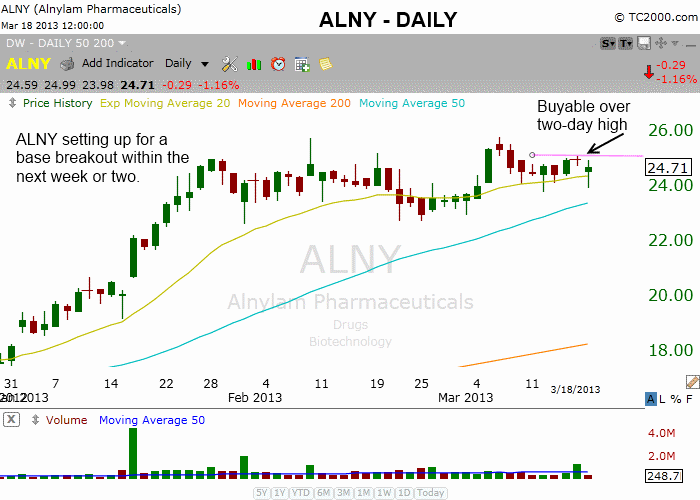
On the stock side our positions held up well. $HCA reversed off the 10-day MA on light volume while $ALNY formed a bullish reversal candle and closed above the 20-day EMA. $SWFT held support of the 10-day MA for the second day in a row and closed in the top third of the day’s range, up 2.2% on higher volume. $SWFT has shown great relative strength the past few days by ignoring the pullback in the S&P 500.
Our scans failed to produce much in the way of actionable setups, as most leading stocks are extended after breaking out with the S&P 500 two weeks ago. As with all good bull markets, rotation among leadership stocks is key, so we should eventually see new setups develop if this market is headed much higher.
For those who are not already long $ALNY, there is a second buy point about 5-cents over the two-day high using the stop posted in the open positions section.

relative strength combo watchlist:
Our Relative Strength Combo Watchlist makes it easy for subscribers to import data into their own scanning software, such as Tradestation, Interactive Brokers, and TC2000. This list is comprised of the strongest stocks (technically and fundamentally) in the market over the past six to 12 months. The scan is updated every Sunday, and this week’s RS Combo Watchlist can be downloaded by logging in to the Members Area of our web site.