Current signal generated on close of Feb. 13.
Portfolio exposure can be anywhere from 50% to 100% long (or more), depending on how open positions have held up.
Past signals:
- Sell signal generated on close of February 3.
- Neutral signal generated on close of January 24.
- Buy signal generated on close of November 13
- Buy signal generated on close of September 9
- Neutral signal generated on close of August 15
- Buy signal generated on close of July 11
- Neutral signal generated on close of July 5
- Sell signal generated on close of June 24
today’s watchlist (potential trade entries):

Having trouble seeing the open positions graphic above? Click here to view it directly on your web browser instead.
Below is an overview of all open positions, as well as a report on all positions that were closed only since the previous day’s newsletter. Changes to open positions since the previous report are listed in pink shaded cells below. Be sure to read the Wagner Daily subscriber guide for important, automatic rules on trade entries and exits.

Having trouble seeing the open positions graphic above? Click here to view it directly on your web browser instead.
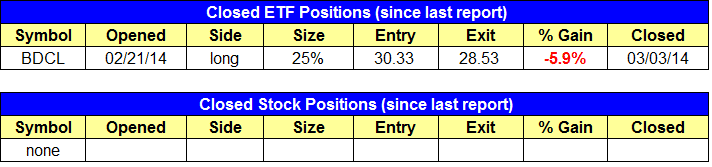
closed positions:
Having trouble seeing the closed positions graphic above? Click here to view it directly on your web browser instead.
ETF position notes:
- Stopped out of half the position in $BDCL.
stock position notes:
- Note that we will take whichever setup triggers first in XOOM.
ETF, stock, and broad market commentary:
Stocks followed through on Friday’s selling with significant weakness on the open and through the morning session. By noon, stocks were able to gain traction and push higher in the afternoon, allowing the major averages to close off the lows of the day.
Although stocks closed in negative territory across the board, the major averages failed to register another distribution day due to lighter volume on the NYSE and Nasdaq exchanges.
The market may need a few days of rest before heading higher. If there is further distribution, then we could potentially see a deeper selloff to the 50-day MA in the major averages.
Most leadership stocks remain in good shape and have yet to flash clear warning signs, so the market timing model remains on a buy.
Money continues to flow into commodities, as evidenced by the weekly chart below in Global X Uranium ETF ($URA):
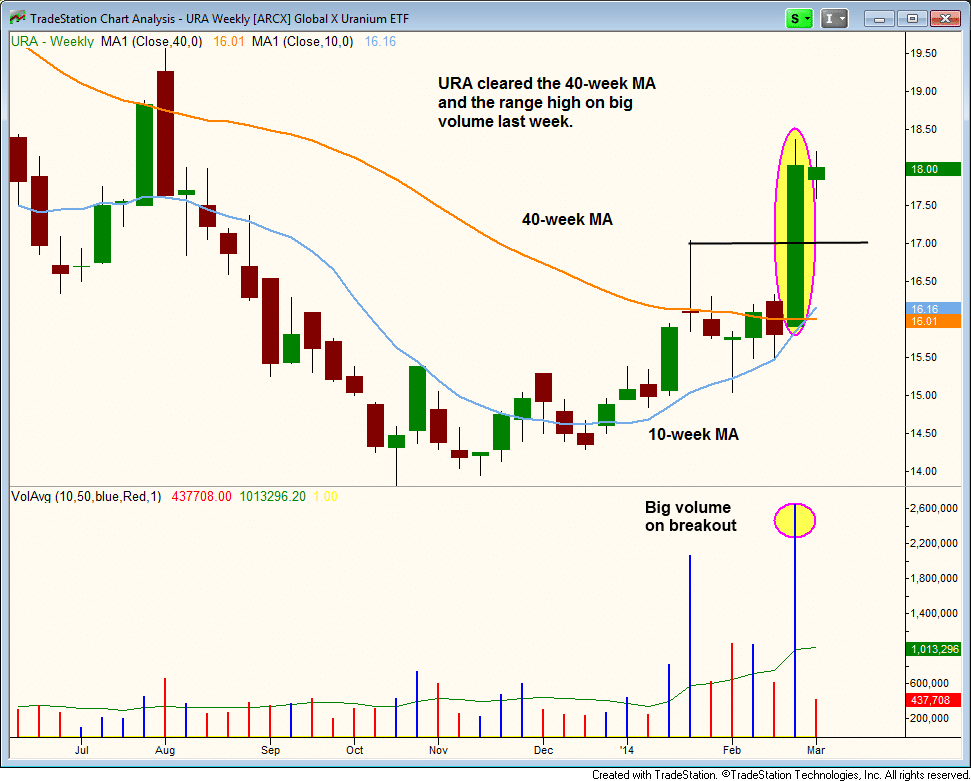
$URA blasted through the range high and 40-week MA on volume that was about 4x greater than the 10-week volume average, and closed near the highs of the week. The 10-week MA crossed above the 40-week MA as well, which signals that there is a bullish reversal of trend under way.
After breaking out above range highs on heavy volume, the price has consolidated for a few days on declining volume, which is exactly what we want to see.
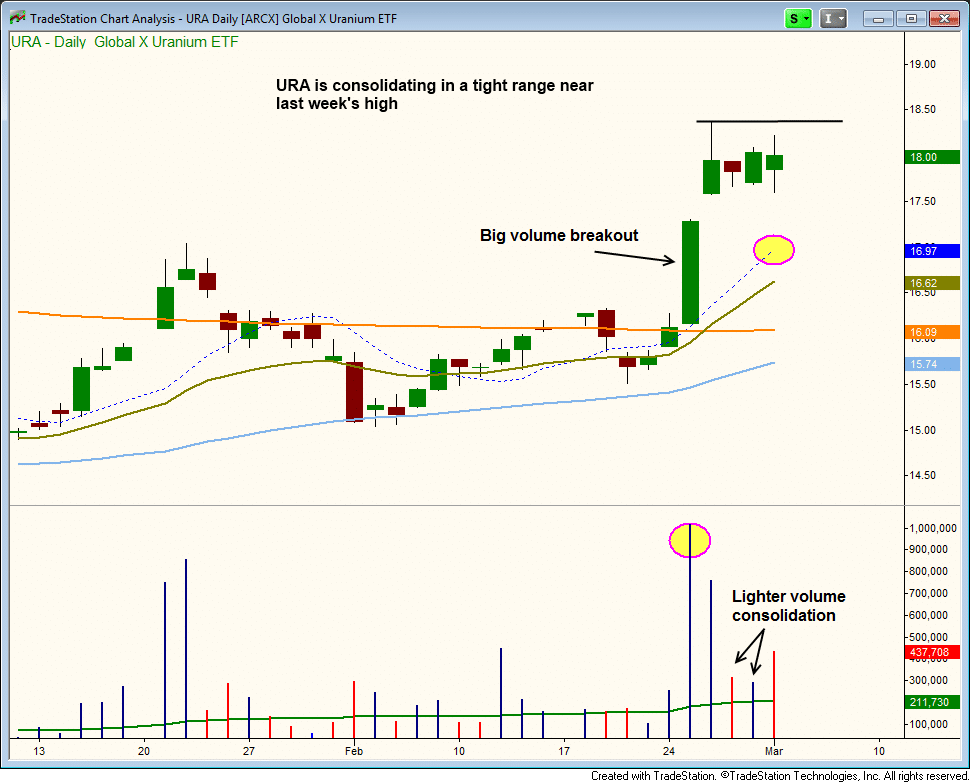
We expect about five to ten days of sideways action bore $URA resumes its uptrend.
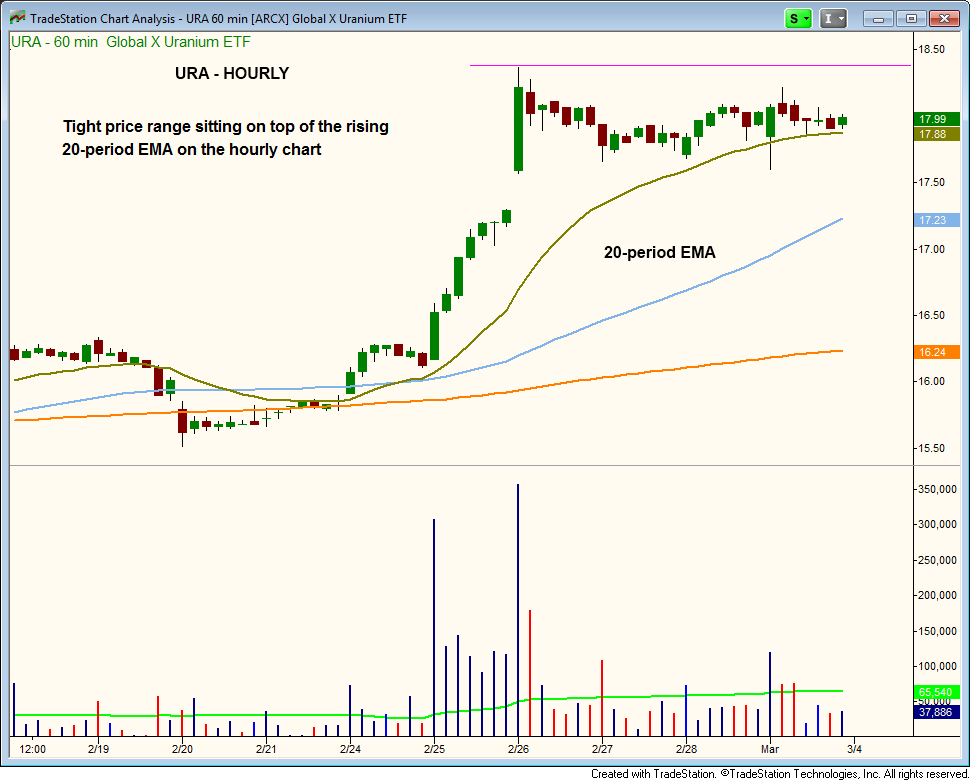
On the hourly chart, the price action is holding above the 20-period EMA, which is usually the first legit support level after a strong breakout. The strongest breakouts will hold support at the 20-period EMA and push higher. If the 20-period EMA fails to hold, then a touch of the 10-day MA is the next logical support level. We are placing $URA on today’s watchlist (trade details can be found above).
On the stock side, most positions held up well by the close. We have one new setup on today’s watchlist in $XOOM. We have a buy stop and buy limit order in place, and whichever setup triggers first is the one we will officially take (the other is to be canceled). If you are unable to place such a trade, then we would simply go with a buy stop to ensure that the trade is not missed.
$XOOM is an IPO from 2013 that has pulled back to support from all major averages and the short-term downtrend line the past few days. It is in the process of emerging from the bottom of the cup portion of a potential cup and handle pattern. Ideally, we’d like to see some weakness on the open tomorrow, followed by a strong move up.
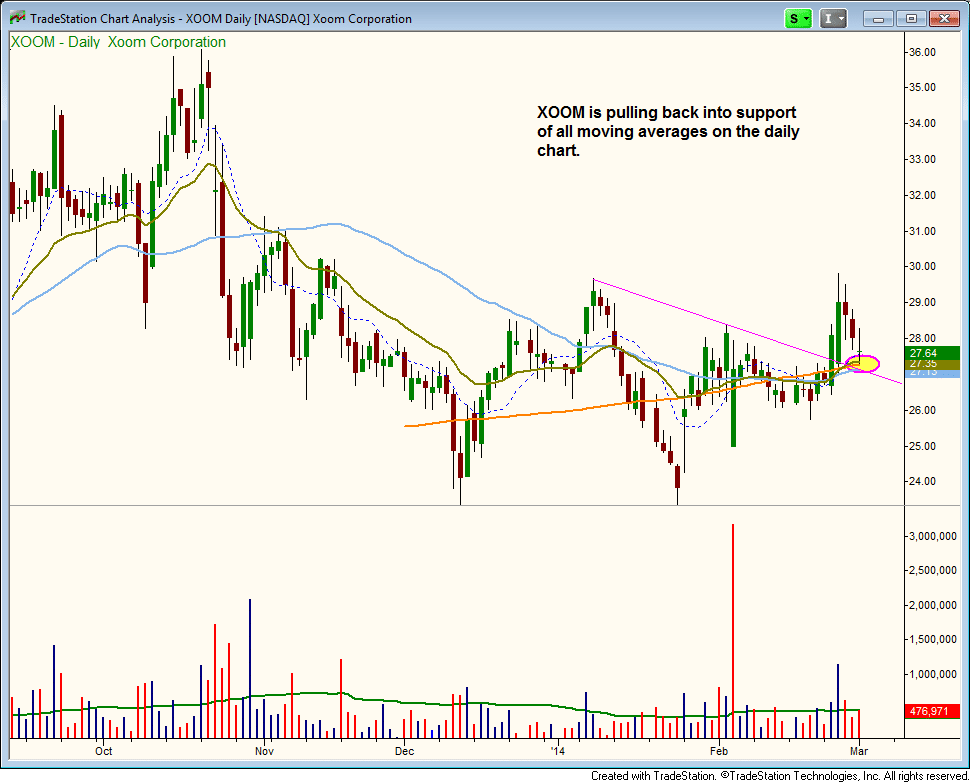
We are only looking to swing trade $XOOM right now, so this is not a core setup.