Current signal generated on close of July 11
Past signals:
- Neutral signal generated on close of July 5
- Sell signal generated on close of June 24
today’s watchlist (potential trade entries):

Having trouble seeing the open positions graphic above? Click here to view it directly on your web browser instead.
open positions:
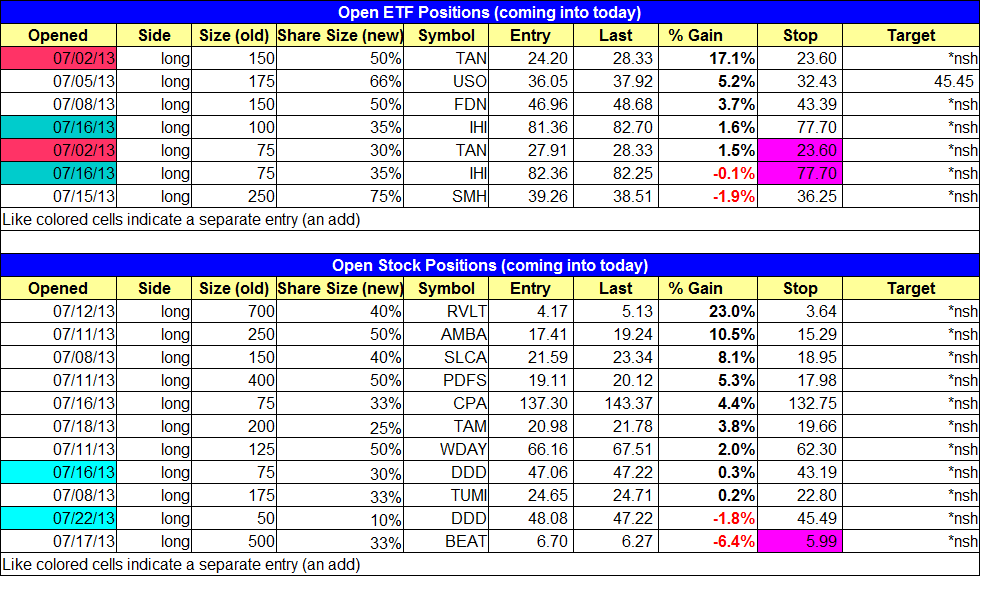
Below is an overview of all open positions, as well as a report on all positions that were closed only since the previous day’s newsletter. Net P/L figures are based a $100,000 model portfolio. Changes to open positions since the previous report are listed in pink shaded cells below. Be sure to read the Wagner Daily subscriber guide for important, automatic rules on trade entries and exits.
Having trouble seeing the open positions graphic above? Click here to view it directly on your web browser instead.
closed positions:

Having trouble seeing the closed positions graphic above? Click here to view it directly on your web browser instead.
ETF position notes:
- Added to $IHI and $TAN
stock position notes:
- Added to $DDD
ETF, stock, and broad market commentary:
The broad market averages basically chopped around all session on light volume, closing with modest gains across the board. With only one distribution day on board, the volume pattern in the market remains quite bullish. This means that although the market could pull back in for a few days, we would expect any selloff to be short-lived and a buying opportunity.
After a few months of selling action, buyers have finally stepped in to gold and silver stocks off the lows. We are trend traders and prefer to see confirmation of a new trend emerge before we take any action. For example, before we enter a stock/ETF we look for the 50-day MA to be in an uptrend and near or above the 200-day MA, which should at the very least be flattening out (not going lower). Both gold and silver ETFs are still in a clear downtrend, with the 50-day MA yet to turn up, so it is simply too early for us to get involved.
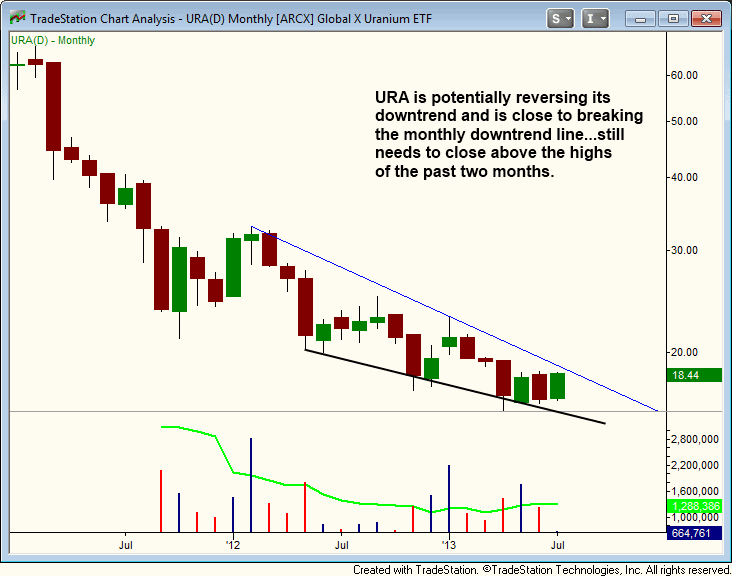
Looking at the monthly chart of Global X Uranium ETF ($URA), we could potentially see a reversal of trend by the end of the month if the price action can close above the two-month high and the downtrend line.
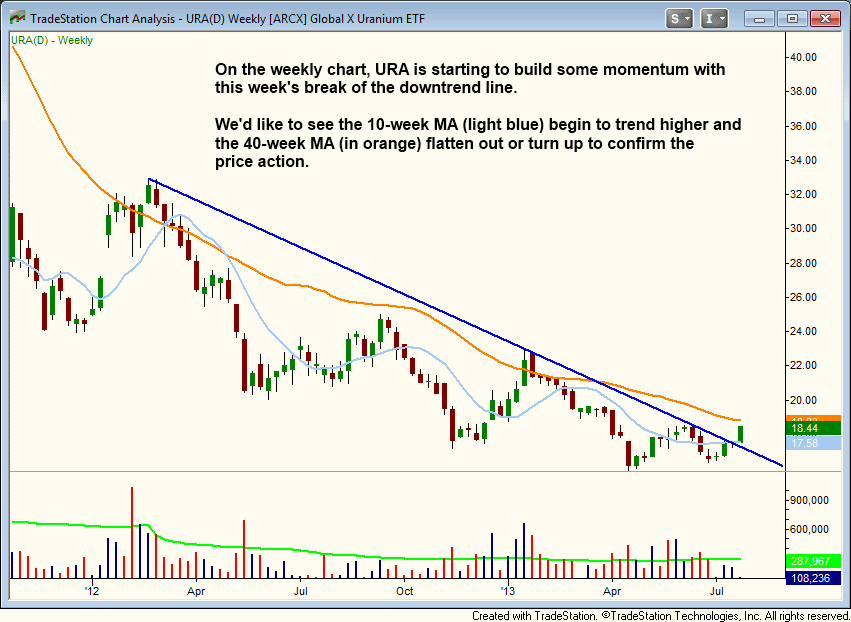
Dropping down to the weekly chart, $URA has broken the downtrend line but has yet the clear the prior highs of June. We talked about the 50 and 200-day MAs confirming a reversal of trend on the daily chart in gold and silver, and we can do the same analysis on the weekly chart with the 10 and 40-week MAs in $URA. The 10-week moving average has flattened out and is trending higher the past two weeks, which is a good sign; however, the 40-day MA needs to flatten out, as it is still trending lower and the 10-week MA is still well below the 40-week MA. This setup is not actionable right now, but it is worth monitoring over the next few weeks.
Adds in $TAN and $IHI followed through to the upside. If $FDN closes below the 10-day MA we will be forced to raise the stop to lock in profits on partial size. The remaining shares will be held with a stop below the 50-day MA. Stay tuned for any changes.
On the stock side, we added to our position in $DDD over the 5-minute high. If $DDD fails to push higher in to earnings, then we will cut the shares we added and hold through earnings with the original 75 shares.
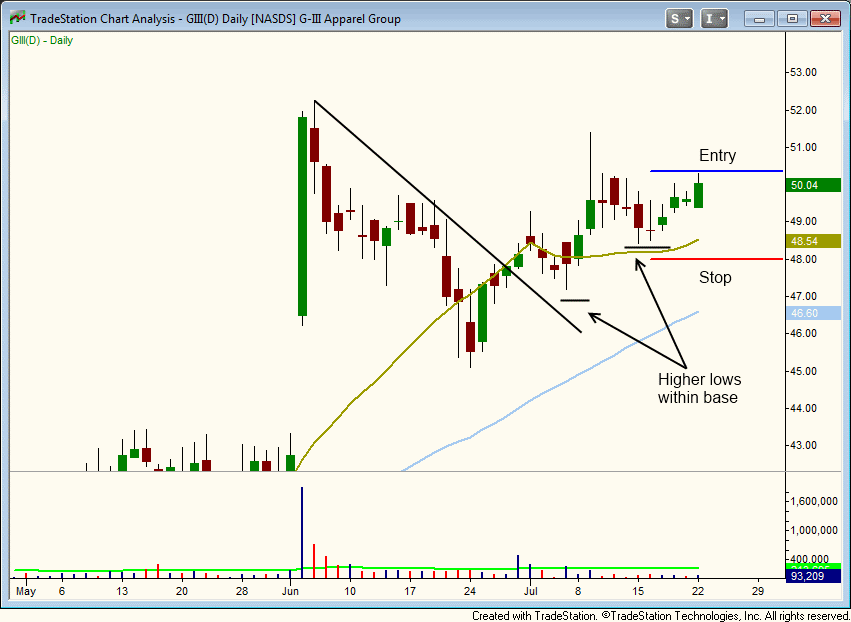
We have two new long setups on today’s watchlist in $KORS and $GIII. We are taking a small position in $KORS at the 50-day MA, where it appears to be finding support, if it can pullback to our limit entry. Remember, this is a buy limit order, not a buy stop, so we are buying on weakness (5-minute rule will not apply).
$GIII recently broke out to new all-time highs on the weekly chart:
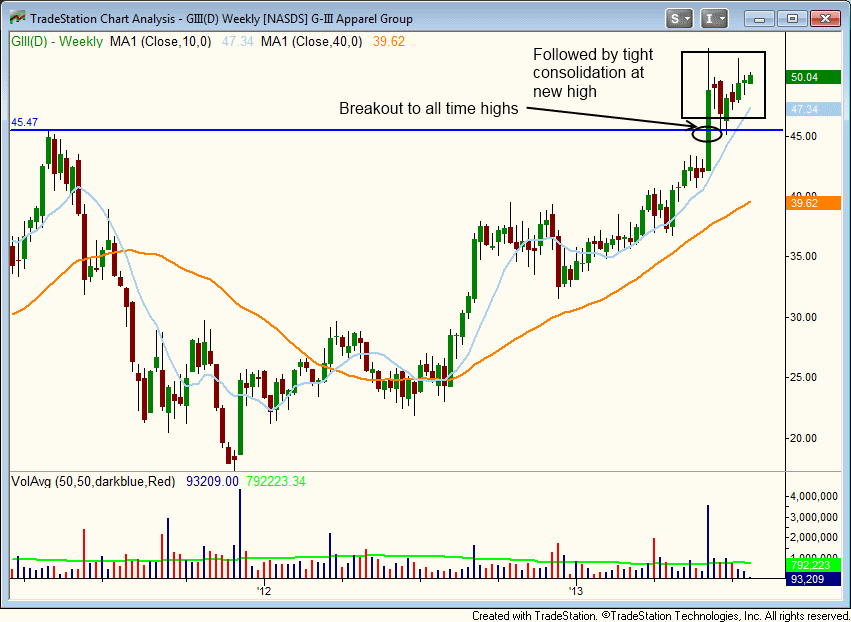
On the daily chart, we see a pretty tight base that has formed above the rising 50-day MA. Note that there are two higher swing lows within the base so far (we usually look for higher lows in the base before we start to buy). The price action has formed a tight range over the past two weeks on light volume, while holding above the 20-day EMA. $GIII has tightened up nicely and could breakout to new highs soon. Earnings are not a concern right now, as it is scheduled to report in September. We are going with a half sized position because $GIII only trades about 150,000 shares per day, which is fine, but not ideal for big size.
