Current signal generated on close of Feb. 13.
Portfolio exposure can be anywhere from 50% to 100% long (or more), depending on how open positions have held up.
Past signals:
- Sell signal generated on close of February 3.
- Neutral signal generated on close of January 24.
- Buy signal generated on close of November 13
- Buy signal generated on close of September 9
- Neutral signal generated on close of August 15
- Buy signal generated on close of July 11
- Neutral signal generated on close of July 5
- Sell signal generated on close of June 24
today’s watchlist (potential trade entries):

Having trouble seeing the open positions graphic above? Click here to view it directly on your web browser instead.
Below is an overview of all open positions, as well as a report on all positions that were closed only since the previous day’s newsletter. Changes to open positions since the previous report are listed in pink shaded cells below. Be sure to read the Wagner Daily subscriber guide for important, automatic rules on trade entries and exits.

Having trouble seeing the open positions graphic above? Click here to view it directly on your web browser instead.
closed positions:
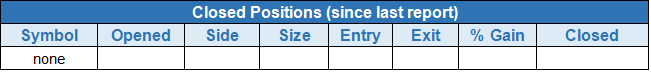
Having trouble seeing the closed positions graphic above? Click here to view it directly on your web browser instead.
ETF position notes:
- $GLDX triggered over the 5-minute high.
stock position notes:
- $CUDA buy stop triggered with higher fill (due to fast move out).
ETF, stock, and broad market commentary:
Stocks traded in a tight range all day, digesting Tuesday’s strong advance on lighter volume. The averages closed mixed on the session with light gains and minor losses.
Tuesday’s rally was confirmed by impressive breadth readings. Up volume beat down volume on the NYSE by an 8 to 1 ratio and well over 500 stocks gained 4% on the day with higher volume. The number of stocks up at least 20% over the past 20 days is also at a very extreme reading. The extreme breadth readings could be signaling that Tuesday’s action was the start of a new rally after a V-shaped correction, or the beginning of an intermediate-term top in the market.
If it is the beginning of a top, then we should see the broad based averages struggle to push higher this month while leading stocks outperform.
If the market is beginning another leg up, then $QQQ and $SPY should be able to push much higher over the next few weeks.
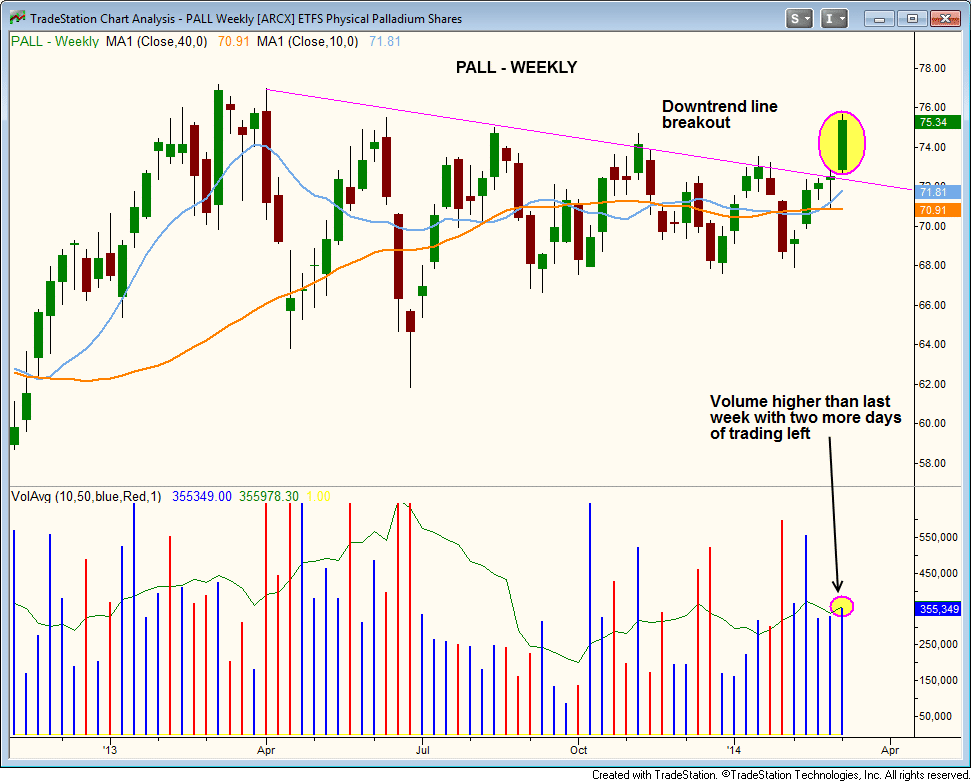
We continue with the commodity theme, as $PALL cleared its weekly downtrend line on heavier than average volume the past two days. Volume this week is already greater than last week’s volume with two more day’s to go. If the breakout can hold, then we will look for the first pullback to the 10-day MA or some type of bull flag as a low risk buy point.
Bullish chart patterns should tighten up from left to right as the consolidation develops. Note the higher swing lows since October in the base. The action has clearly tightened up.
$UNG appears to have found support at the 20-day EMA after a false breakout above $27 a few weeks ago. Volume has declined during the consolidation, which is a good sign (quiet/tight action should be confirmed by quiet or lighter volume).
There is also support from a short-term downtrend line in the same area as the 20-day EMA. Should $UNG fail to hold the 20-day EMA, then a test of the 50-day MA is likely, which could also present us with a low risk buy entry.
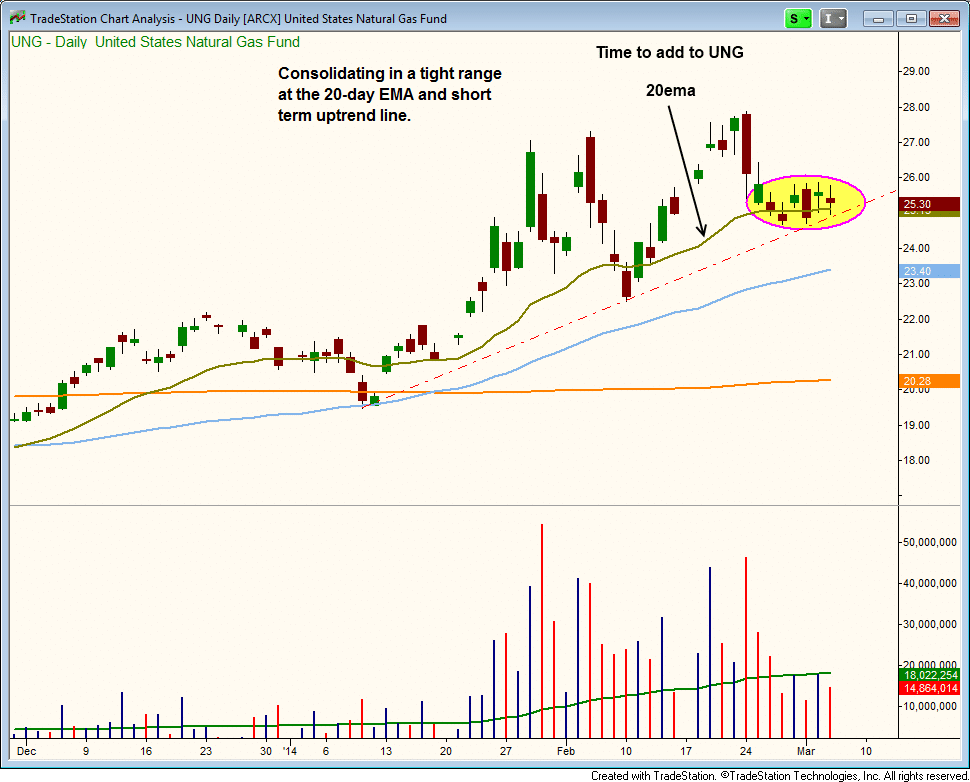
We are placing $UNG on today’s watchlist. The add is 25%, which would bump the position in $UNG up to 75%.
On the stock side, we added one new position in $CUDA, which followed through to the upside on a pick up in volume.
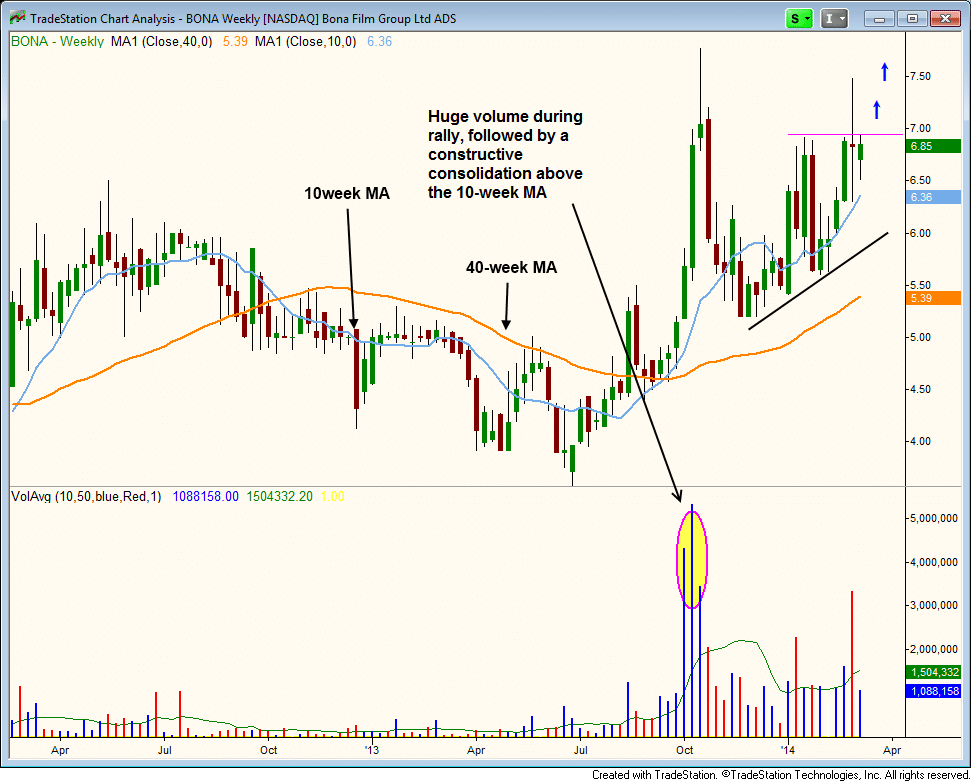
We have two new setups tonight. One is a pullback entry using a buy limit order in $FOE. The other is a potential breakout entry in $BONA, which has formed a bullish weekly consolidation after a strong price and volume breakout above $5 in October.
The big volume on the way up suggests that the current consolidation will eventually give way to another wave up.
The buy entry is over the 2-day high with a stop beneath the recent swing low.