Current signal generated on close of January 24.
Portfolio exposure can be anywhere from 0% to 60% long (or more), depending on how open positions have held up the past three days.
Past signals:
- Buy signal generated on close of November 13
- Buy signal generated on close of September 9
- Neutral signal generated on close of August 15
- Buy signal generated on close of July 11
- Neutral signal generated on close of July 5
- Sell signal generated on close of June 24
today’s watchlist (potential trade entries):

Having trouble seeing the open positions graphic above? Click here to view it directly on your web browser instead.
Below is an overview of all open positions, as well as a report on all positions that were closed only since the previous day’s newsletter. Changes to open positions since the previous report are listed in pink shaded cells below. Be sure to read the Wagner Daily subscriber guide for important, automatic rules on trade entries and exits.

Having trouble seeing the open positions graphic above? Click here to view it directly on your web browser instead.
closed positions:
Having trouble seeing the closed positions graphic above? Click here to view it directly on your web browser instead.
ETF position notes:
- No trades were made.
stock position notes:
- No trades were made.
ETF, stock, and broad market commentary:
Stocks got off to a great start with broad market averages gapping about 1% higher on the open and following through another 1% or so to the upside by 1 pm. The averages chopped around the rest of the afternoon and closed in the top third of the day’s range. It was a solid day of price action in tech stocks, as the Nasdaq Composite reclaimed the 50-day MA. The Dow Jones was a noticeable laggard, still trading below the 20-period EMA on the hourly chart.
Yesterday’s advance was not confirmed by volume, as turnover was lighter on both the NYSE and Nasdaq. The market volume patterns remain quite bearish, with four of the past six sessions producing a distribution day.
We mentioned in yesterday’s report that a move above Thursday’s high in the broad market averages could spark a short-term bounce, and that looks to be playing out right now. That being said, market conditions are very unstable. At best the market may simply chop around or slowly grind higher for a few weeks. There is also the possibility that the market sells off once again on Friday on higher volume. This is why the timing model is no longer in buy mode, as the reliability factor is just not there.
The leadership portion of our timing model is clearly outperforming the broad market averages. The weekly charts of most leadership stocks remain in decent shape, which is why we are hesitant to shift the model into sell mode.
Current long holdings in both the ETF and stock portfolios are in pretty good shape. Most of them are holding up better than the market and still trading above the 50-day MA.
Our current long position in Facebook ($FB) closed with a 14% gain after reporting earnings on Wednesday night. We are now up about 28% from the original entry point. The gap up in $FB also sparked a 7% rally in the Global X Social Media ETF ($SOCL), which we are also long in the ETF portfolio.
After breaking out above $22 on big volume last week, United States Natural Gas ETF ($UNG) looks to be in pullback mode after breaking down below the 20-period EMA on the hourly chart. We look for $UNG to potentially touch the rising 10-day MA within the next day or two, which could provide us with a low risk entry point to climb aboard an explosive uptrend.
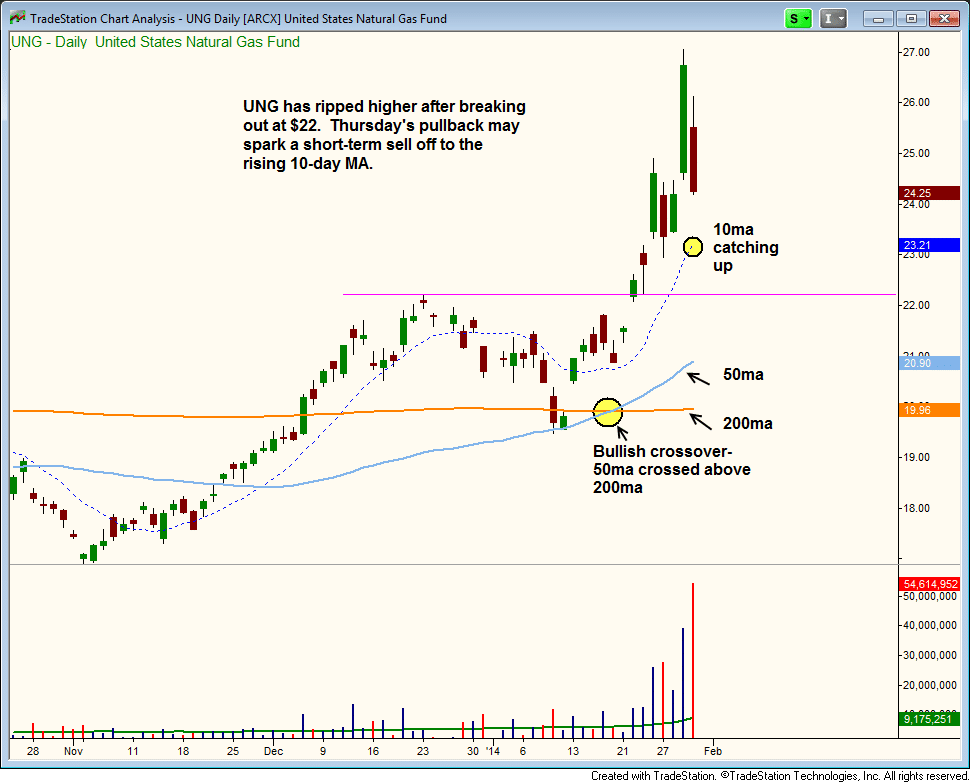
We are placing $UNG on today’s watchlist. Trade details can be found above
Gold ETF ($GLD) sold off about 2% yesterday, closing just above the the 50-day MA. Thursday’s selloff is a warning that the current counter-trend rally off the lows may be over. We look for a resumption of the downtrend with a close below the 50-day MA in $GLD. We are currently short $GLD through the inverted Gold Double Short ETN ($DZZ), which bounced off support of the uptrend line this week. Note that there is significant support around $6.70.
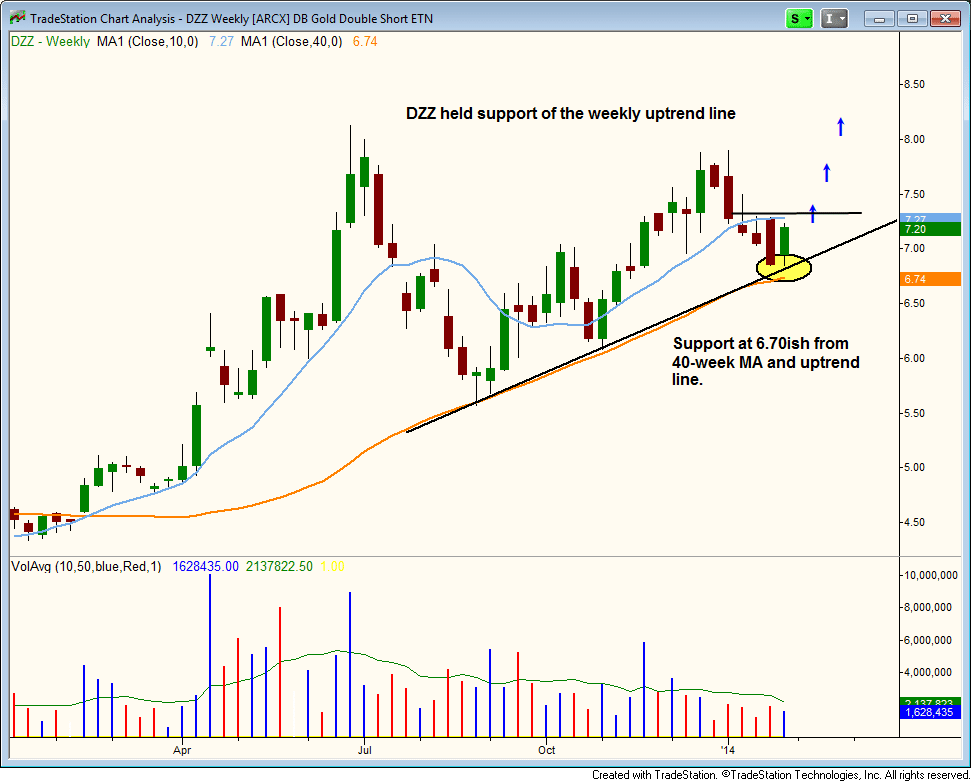
The plan is to add to our current long position in $DZZ on strength, so we are placing $DZZ on today’s watchlist. Trade details can be found above
On the stock side we are in great shape with $FB. Even if the gap up fails, we can still book a decent profit of 17-18% (please note the new stop price in $FB and a few other open positions above).
We may potentially look to re-enter $MDCO next week as it pulls into support of the 200-day MA, or if it forms a reversal candle just shy of the 200-day MA. We will probably keep the share size to less than 50% because the action has been quite lethargic.
Although we have been laying low this past week, we wouldn’t mind entering a leading stock on weakness if the opportunity presents itself, but we do not want to chase the action. So patience is key here as we wait for strong setups to produce decent entry points.