Commentary:
The major indices opened Monday’s session with a solid morning gap up, but at 10:00 am the market was met with resistance, and stocks sold off. For most of the day the market “chopped” within a tight trading range, but the day ended with another brisk wave of selling. As discussed in yesterday’s newsletter, the Dow Jones Industrial Average and the S&P 500 have rallied into key technical resistance levels. The DJIA made an early attempt to take out the April high of 11,258, but fell short by 11 points and fizzled into the close. The S&P 500 has yet to touch its 50-month Simple Moving Average since the market began rallying in March of 2009. Still, all of the major indices managed to close in positive territory. The small-cap Russell 2000 led all indices by gaining 0.6%. The MidCap S&P 400 and the Nasdaq both realized 0.5% increases. The Dow Jones Industrial Average closed in the green by 0.3%, while the S&P 500 could only “muster” a 0.2% gain on the day. The top performing sectors were the Materials and Consumer Discretionary sectors, up 2.16% and 0.63% respectively. The Financial Sector was the weakest as it shed 0.4% for the session. Utilities also showed relative weakness by closing down 0.2%.
Volume was dramatically higher on the NYSE versus the Nasdaq. NYSE volume rocketed higher by 28%, while the Nasdaq registered a modest 4% improvement on Monday. Advancing volume outpaced declining volume on both indices. The ratio of advancing to declining volume was 1.9 to 1 on the Nasdaq and 1.8 to 1 on the NYSE. Overall, the internals were benign, as neither the bulls nor the bears could “wrestle” control of the market. However, the longer the major indices consolidate at the current levels; the more likely the next move will be up.
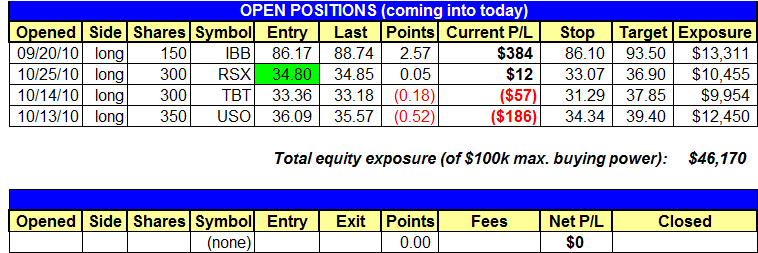
In yesterday’s newsletter, we officially placed the Market Vectors Russia Trust (RSX) on our Watchlist. This morning RSX hit our trigger price and we entered the trade. For our regular subscribers, the details of trade can be found in the Daily Performance Report section of the newsletter. Another potential trade discussed in Monday’s issue, was the ETF Direxion Daily Semiconductor Bull 3X (SOXL). Today, SOXL also broke above resistance. We are monitoring this SOXL for a possible entry point.
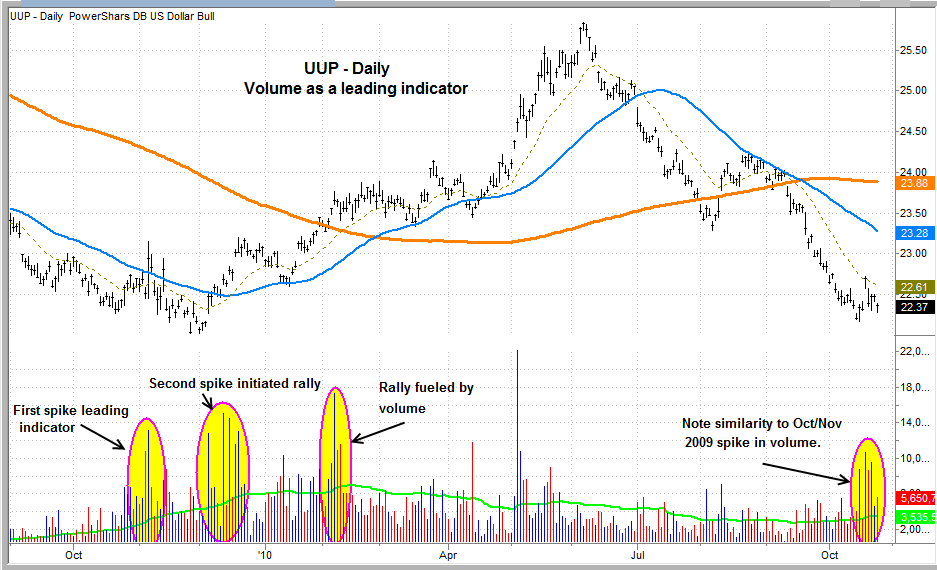
Often, volume is a good leading indicator of a trend reversal. A case in point is the PowerShares DB USD Bull ETF (UUP). In November 2009, the dollar had plummeted to all time lows against several major currencies. As would be expected, UUP did the same. However, during this timeframe, the volume in UUP spiked considerably from late September to November 5th, 2009 (see chart). One month later, on December 4th, 2009, UUP witnessed another huge spike in volume. This ETF rallied for over seven months, with continual volume spikes along the way. The rally reached its peak on June 6th of this year. UUP may now again, be reaching a bottom. Notice the massive pick-up in volume over the past 10 days. The reason that volume can be a good technical indicator of trend reversal, is that it reflects capitulation in the market. If a trading instrument will no longer drop (or increase) in value in the midst of a massive volume spike, this may be a signal that the sellers (or buyers) have dried up and a trend reversal may be at hand. However, we rarely use volume alone as a signal to enter a trade.
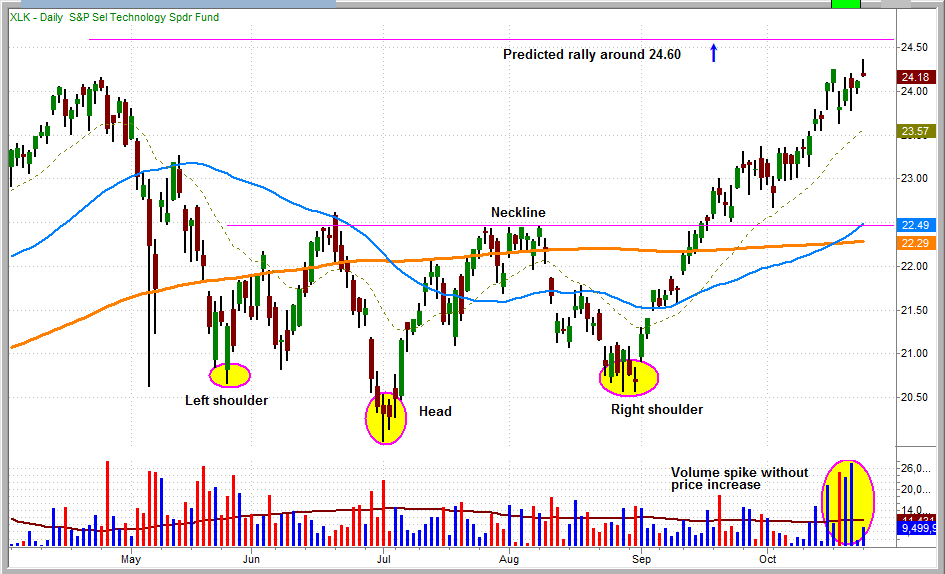
The Select Sector SPDR Technology Fund (XLK), provides a good example of using multiple indicators to determine a potential point of reversal. As was demonstrated with UUP, XLK has seen a large volume spike recently. However, XLK may be near the end of its recent rally. In addition to the dramatic volume increase, there is another technical indicator that supports a trend reversal may be near. Notice the inverse head-and-shoulders pattern that began forming on May 25th of this year. The 25th marks the bottom of the left shoulder. The bottom of the head was formed on July 1st and the bottom of the right shoulder was set on August 27th. The horizontal line marks the neckline of this pattern. Once XLK rallied and closed above the neckline, its predicted advance was the distance measured from the bottom of the head to the neckline. XLK is now trading within thirty cents of the expected rally. The presence of both technical extremes, suggests that the odds may be against entering this trade on the long side.
We continue to remain cautious about the duration of the rally. The underperformance of the banking system is of concern. As technical traders we “don’t fight the trend”. Instead, we look for technical signs of a potential trend reversal. Not until a reversal is confirmed do we look to enter trades in the opposing direction. We are keeping a close eye on the banking sector, as its performance may be the key to the next move in the broad market.
Today’s Watchlist:
There are no new setups for today. We will send an Intraday Alert if anything catches our eye while trading.
Daily Performance Report:
Below is an overview of all open positions, as well as a performance report on all positions that were closed only since the previous day’s newsletter. Net P/L figures are based on the $50,000 Wagner Daily model account size. Changes to open positions since the previous report are listed in red text below. Please review the Wagner Daily Subscriber Guide for important, automatic rules on trigger and stop prices
- RSX buy entry triggered on the open.
- Reminder to subscribers – Intraday Trade Alerts to your e-mail and/or mobile phone are normally only sent to indicate a CHANGE to the pre-market plan that is detailed in each morning’s Wagner Daily. We sometimes send a courtesy alert just to confirm action that was already detailed in the pre-market newsletter, but this is not always the case. If no alert is received to the contrary, one should always assume we’re honoring all stops and trigger prices listed in each morning’s Wagner Daily. But whenever CHANGES to the pre-market stops or trigger prices are necessary, alerts are sent on an AS-NEEDED basis. Just a reminder of the purpose of Intraday Trade Alerts.
- For those of you whose ISPs occasionally deliver your e-mail with a delay, make sure you’re signed up to receive our free text message alerts sent to your mobile phone. This provides a great way to have redundancy on all Intraday Trade Alerts. Send your request to [email protected] if not already set up for this value-added feature we provide to subscribers.
Having trouble seeing the position summary graphic above?
Click here to view it directly on your Internet browser instead.
Notes:
Edited by Deron Wagner,
MTG Founder and
Head Trader