Current signal generated on close of November 13.
Portfolio exposure can be anywhere from 25% to 50% long. If positions are holding up well, then one can add exposure beyond 50%.
- Neutral signal generated on close of November 6.
- Buy signal generated on close of September 9
- Neutral signal generated on close of August 15
- Buy signal generated on close of July 11
- Neutral signal generated on close of July 5
- Sell signal generated on close of June 24
Past signals:
today’s watchlist (potential trade entries):

Having trouble seeing the open positions graphic above? Click here to view it directly on your web browser instead.
Below is an overview of all open positions, as well as a report on all positions that were closed only since the previous day’s newsletter. Changes to open positions since the previous report are listed in pink shaded cells below. Be sure to read the Wagner Daily subscriber guide for important, automatic rules on trade entries and exits.

Having trouble seeing the open positions graphic above? Click here to view it directly on your web browser instead.
closed positions:

Having trouble seeing the closed positions graphic above? Click here to view it directly on your web browser instead.
ETF position notes:
- $MLPL buy stop triggered.
stock position notes:
- $SSNI buy stop triggered.
ETF, stock, and broad market commentary:
Just looking at the percent gains in the major averages, one would have expected a relatively quiet day on Wall Street. However, the intraday action was quite the roller-coaster ride, highlighted by a bullish reversal off the lows in the final two hours of trading.
With the averages closing in the upper half of the day’s range, the pick up in volume on both exchanges registered a bullish accumulation day for the S&P 500 and NASDAQ Composite.
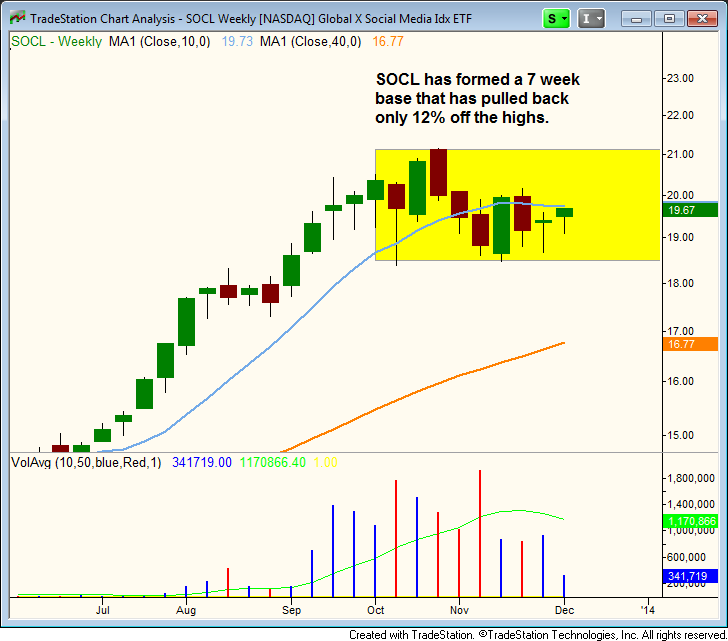
We have two new buy setups on today’s ETF watchlist. The first setup is a buy off the lows of a seven-week base in the Global X Social Media Index ETF ($SOCL).
$SOCL held above $18.50 during the consolidation, and now appears poised to break back above the 10-week MA.
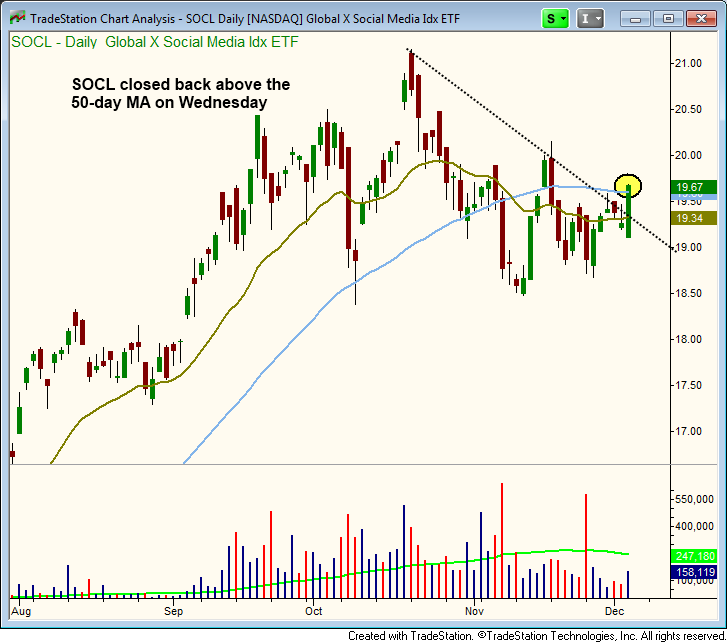
The daily chart shows $SOCL reclaiming the 50-day MA yesterday on a pick up in volume. If $SOCL can hold above the 50-day MA the next few weeks, then it should flesh out the “right side” of the pattern.
Our second buy setup is in the First Trust NASDAQ Clean Edge ETF ($QCLN), which has formed a tight, seven week base at the highs. Volume has declined the past few weeks, which is a bullish sign, telling us that traders have given up on the stock/ETF moving higher in the short term, and are putting their money to work elsewhere.
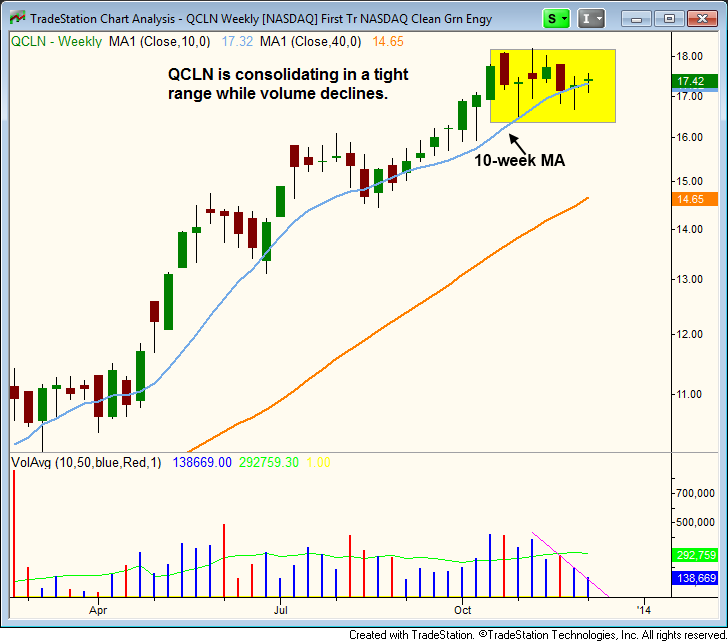
The 10-week MA remains in a clear uptrend, and the price has yet to close below the 10-week MA during the base.
Due to the weird fill in $MLPL yesterday, we are reducing the stop in $MLPL by 50 cents to give the trade a bit more breathing room.
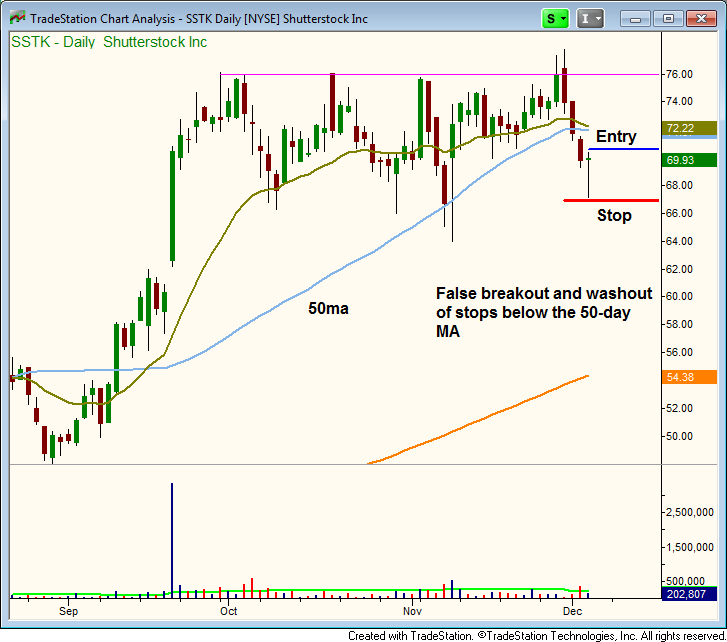
On the stock side, $SSNI buy stop triggered. We have one new buy setup in $SSTK, which put in a bullish reversal candle yesterday after running stops below the 50-day MA.