market timing model: BUY
Current signal generated on close of November 13.Portfolio exposure can be anywhere from 25% to 50% long. If positions are holding up well, then one can add exposure beyond 50%.Past signals:
- Neutral signal generated on close of November 6.
- Buy signal generated on close of September 9
- Neutral signal generated on close of August 15
- Buy signal generated on close of July 11
- Neutral signal generated on close of July 5
- Sell signal generated on close of June 24
today’s watchlist (potential trade entries):

Having trouble seeing the open positions graphic above? Click here to view it directly on your web browser instead.
open positions:
Below is an overview of all open positions, as well as a report on all positions that were closed only since the previous day’s newsletter. Changes to open positions since the previous report are listed in pink shaded cells below. Be sure to read the Wagner Daily subscriber guide for important, automatic rules on trade entries and exits.

Having trouble seeing the open positions graphic above? Click here to view it directly on your web browser instead.
closed positions:

Having trouble seeing the closed positions graphic above? Click here to view it directly on your web browser instead.
ETF position notes:
- No trades were made.
stock position notes:
- $EVR buy setup triggered.
ETF, stock, and broad market commentary:
An ugly selloff in the final 90 minutes of trading forced most broad averages into negative territory by the close. The Dow Jones and S&P 500 held up fairly well, but the late plunge created ugly reversal candles on the daily charts of the NASDAQ Composite, Russell 2000, and S&P 400.
Turnover failed to confirm the bearish price action, as volume was slightly lower on both exchanges. The light volume prevented the NASDAQ from suffering a bearish distribution day from churning at the highs.
Churning is when a market attempts to move to new swing highs intraday, but finishes well off the highs of the session by the close. Total volume must increase over the prior session to confirm the churning.
Our long scans have dried up on the ETF and stock side as of late, so we would actually welcome a short-term pullback in the market to produce some shakeout entries.
If the market does pull in, then we’d like to see recent breakouts such as the S&P Regional Banking ETF ($KRE) not give up much ground. There is support from the prior highs of last August and the rising 10-week MA around the $37 to $37.50 area.
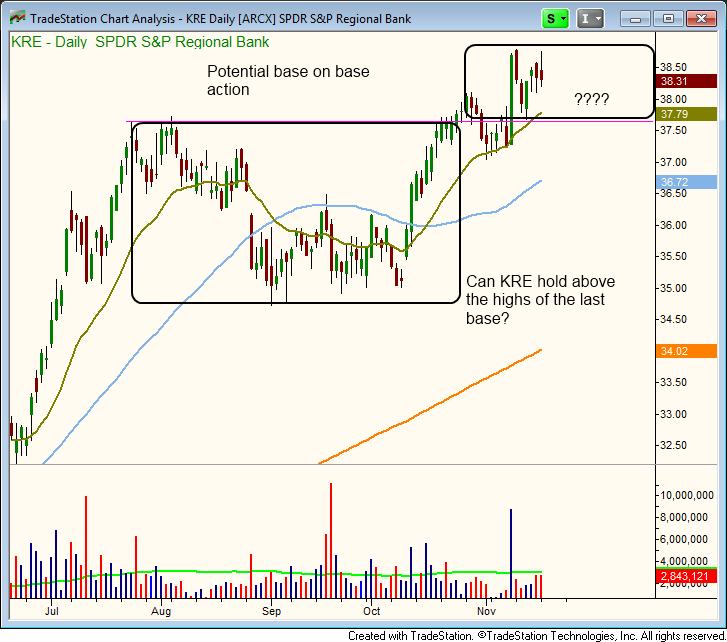
The current consolidation should be contained by the smaller box in the upper right hand side of the chart. This box is above the bigger box on the left (creating a base on base type look).
$KRE is not actionable here, but could be on a pullback to the rising 10-week MA, especially if a bullish reversal candle forms on the weekly chart.
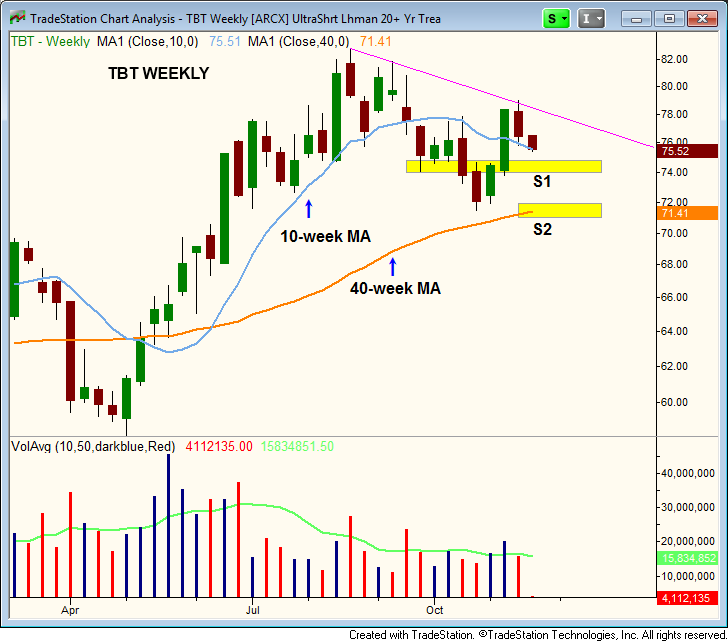
ProShares UltraShort Lehman 20+ Yr($TBT) is currently in pullback mode after a two week bounce on higher volume that closed back above the 10-week MA. $TBT does have support from a prior swing low at $74 in late September (marked S1 on the chart below). If the $74 level holds, then $TBT will print its first higher swing low within the current 14-week consolidation.
If the $74 level can’t hold, then the next logical support area is the 40-week MA (or 200-day MA on the daily chart) at $71 (S2). Patience is key here as we let the setup play out. If $TBT does come down to the 40-week MA, it will present us with a low risk entry point for an intermediate-term position trade (holding period of several months).
On the stock side, we established one new entry in $EVR, which sold off with the market and produced a false breakout. The weekly chart still looks good, so as long as the price action holds above the 50-day MA the trade should be fine.
$MCHP responded well to a downgrade, finishing in the top third of the day’s range and above the 10-day MA.
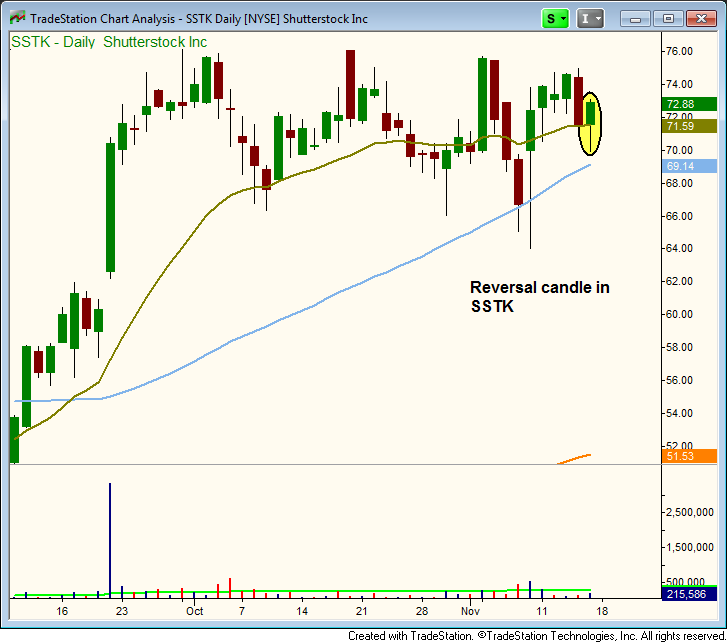
$SSTK triggered the 5-minute rule yesterday, as our entry price was hit within the first 5-minutes of trading. When this happens we simply wait for 5-minutes to pass and add 10 cents to the 5-minute high as the new entry price. See the new entry price above.
Patience is the key here, as we wait for new setups to develop. There isn’t much to get excited about on the long side right now, but that could easily change in a few days.