market timing model: (Confirmed) Buy
Current signal generated on close of September 9.We are now in confirmed buy mode, so portfolio exposure can be more than 100% if you have a marginable account. However, please make sure that current long positions in your portfolio are working before adding new ones. Portfolio exposure should be at least 75% to 100% (or more) right now.
Past signals:
- Neutral signal generated on close of August 15
- Buy signal generated on close of July 11
- Neutral signal generated on close of July 5
- Sell signal generated on close of June 24
today’s watchlist (potential trade entries):

Having trouble seeing the open positions graphic above? Click here to view it directly on your web browser instead.
open positions:
Below is an overview of all open positions, as well as a report on all positions that were closed only since the previous day’s newsletter. Changes to open positions since the previous report are listed in pink shaded cells below. Be sure to read the Wagner Daily subscriber guide for important, automatic rules on trade entries and exits. Click here to learn the best way to calculate your share size.

Having trouble seeing the open positions graphic above? Click here to view it directly on your web browser instead.
closed positions:
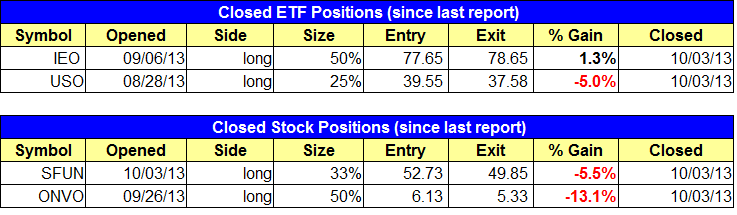
Having trouble seeing the closed positions graphic above? Click here to view it directly on your web browser instead.
ETF position notes:
- As planned, we sold all of $IEO and partial size in $USO on the open. $PPA buy entry triggered on the open.
stock position notes:
- $ONVO stop triggered. $SFUN buy entry triggered on the open, but stopped us out later in the day.
ETF, stock, and broad market commentary:
The major averages registered a clear distribution day yesterday, with losses in -0.8% to -1.1% range on a pick up in volume. It was the first true day of distribution across the board in some time, as most indices closed near the bottom third of the day’s range.
Our market timing model remains in buy mode, as the NASDAQ Composite is still in good shape and the S&P 500 has pulled back into support on the weekly chart, which we will cover in more detail below. Some leading stocks were knocked around a bit on a pick up in volume, but there was little to no significant damage done to the charts.
We established a long position yesterday in $PPA on a pullback to support of the 10-week MA. We also sold $IEO for a small gain and sold partial size in $USO for a small loss into the bounce off the lows. We still remain long $USO with a half position from our original entry at $36.
As mentioned above, the S&P 500 ETF ($SPY) has pulled back into a decent support level on the weekly chart. This week’s action has undercut the 10-week MA and touched the uptrend line, which if it holds, will create the third touch needed to validate the trend line.

After a strong surge off the August lows, Merrill Lynch Semiconductors HOLDRS ($SMH) is in pullback mode the past two weeks. If the price action continues to consolidate above the 38% Fibo level connecting the last swing high and low on the weekly chart below, then we could see a bull flag type pattern develop. With bull flags, we love to see symmetry. If the pole section of the flag takes 5 weeks to form, then the flag portion should take no more than 3 to 5 weeks (maybe even 6) before breaking out. One or two more weeks sideways would be ideal in $SMH, followed by a breakout to new highs on the year.

On the stock side we stopped out of $ONVO and $SFUN. $SFUN got off to a great start, but we picked the wrong day to add a new breakout, as the morning selloff turned $SFUN into a false breakout in no time. This is basically why we went with a tight stop and reduced position size, as it was a “go-or-no-go” type situation.
$LKNKD continues to trade in a fairly tight range at the highs. We still like $LNKD on a pullback entry near the 10-week MA or 50-day MA. As long as $LNKD holds the uptrend line, then we should see a few more weeks of bullish consolidation followed by an eventual breakout to new all-time highs. Our buy limit order will remain just below $240, but we have backed the size down to 33%. Since we are currently long a 33% position, our new plan is to add another 33% at the $239 buy limt, and add the remaining 33% at or near a break of the downtrend line
