market timing model:
SELL (click here for more details)
today’s watchlist (potential trade entries):

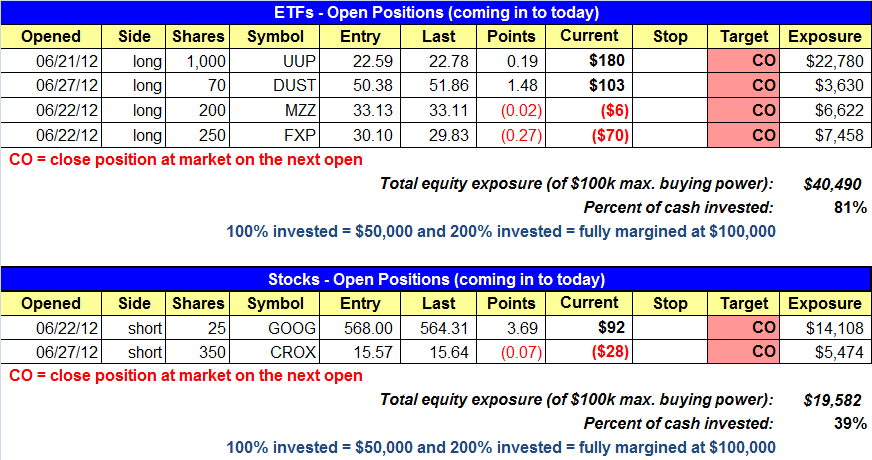
open positions:
Below is an overview of all open positions, as well as a report on all positions that were closed only since the previous day’s newsletter. Net P/L figures are based on two separate $50,000 model portfolios (one for ETFs and one for stocks). Changes to open positions since the previous report are listed in red shaded cells below. Be sure to read the Wagner Daily subscriber guide for important, automatic rules on trade entries and exits.

Having trouble seeing the open positions graphic above? Click here to view it directly on your web browser instead.
closed positions:

Having trouble seeing the closed positions graphic above? Click here to view it directly on your web browser instead.
ETF position notes:
- Note that we are closing open positions at market on the open.
stock position notes:
- EBAY long setup has been canceled due to yesterday’s ugly action.
- Note that we are closing open positions at market on the open.
ETF and broad market commentary:
Stocks reversed dramatically in the final hour of trading yesterday, to end the session mixed. Trade was brisk across the board. All of the major indices were down by 1.2% or more intraday, before the market staged its impressive comeback. The S&P MidCap 400 showed relative strength, as it fought its way back from early losses to post a 0.3% gain. The small-cap Russell 2000 ended the session flat, while both the DJIA and the S&P 500 posted modest 0.2% declines. The Nasdaq also made an impressive recovery but still finished the lower by 0.9%. At one point during the session, the tech-rich index was down by 2.0%.
For a third straight session, market internals ended mixed. Volume finished higher on the Nasdaq by 7.1% and on the NYSE by 17.0%. Advancing volume outpaced declining volume on the NYSE by a ratio of 1.3 to1. However, declining volume held the upper hand over advancing volume on the Nasdaq by a factor of 2.5 to 1. Yesterday’s sharp reversal points to institutional accumulation on NYSE and S&P 500. Although we may be hard pressed to make a call for an accumulation day on the Nasdaq, the late day price and volume action were, at a minimum, quite bullish.
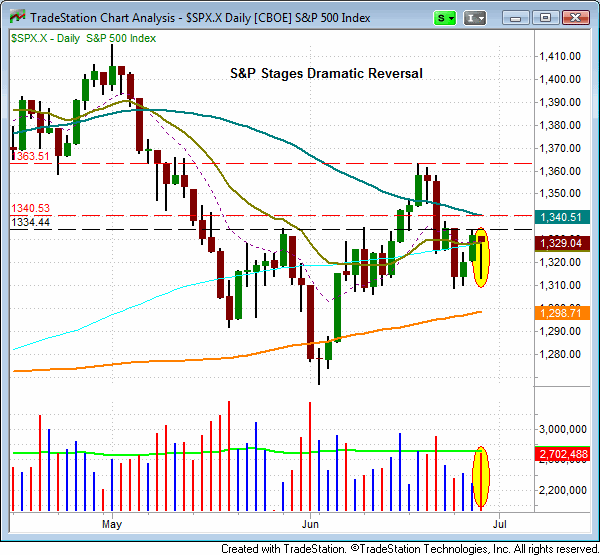
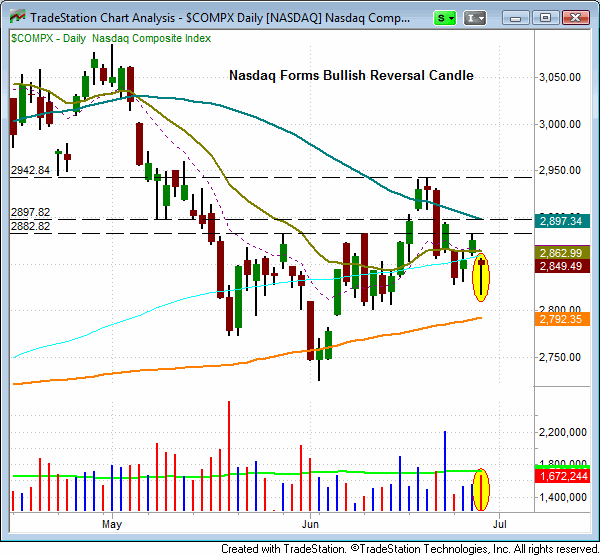
A quick review of the S&P 500 and the Nasdaq should provide a compelling visual, as to the strength of yesterday’s reversal.
The S&P 500 quickly lost support of its 20-day EMA yesterday, and appeared ready to test its four day low. However, after setting the intraday low around 2:30 pm, the S&P rallied in the last hour of trading to close near the day’s high. Above the two day high of 1334, the S&P 500 should see resistance at 1340 and 1364.

The Nasdaq also recovered strongly. The Nasdaq appeared to be in big trouble when it lost support of the four day low. However, the tech-rich index also closed near session highs. The Nasdaq should now find resistance at its 20-day EMA (2862), the two day high (2898), the 50-day EMA (2897) and the June 20th swing high of 2942.

Although both the Nasdaq and the S&P 500 still face formidable overhead, yesterday’s price action suggests to us, that market bears may be about to cede control…at least for a while.
What was shaping up to be a very solid day for all of our open positions, turned out to be a disappointment. Given the sustained, volume fueled, late day reversal, we will be closing all of our open positions at the market, on the open. It makes little sense to stay in these positions in the wake of the late session reversal. Yesterday provides an excellent case for why we ignore the news. Early in the session, the “talking heads” were clamoring that the market was sinking due to “the Supreme Court’s decision on health care reform.” However, by the closing bell, the market had staged an impressive bullish reversal. Was this reversal also a result of the Supreme Court’s decision on health care reform? News doesn’t drive the market, the market drives the news. The news media merely observe what happens in the market and then create a story in an attempt to provide an explanation. Why does there have to be an explanation? That’s why we just follow the tape.
stock commentary:
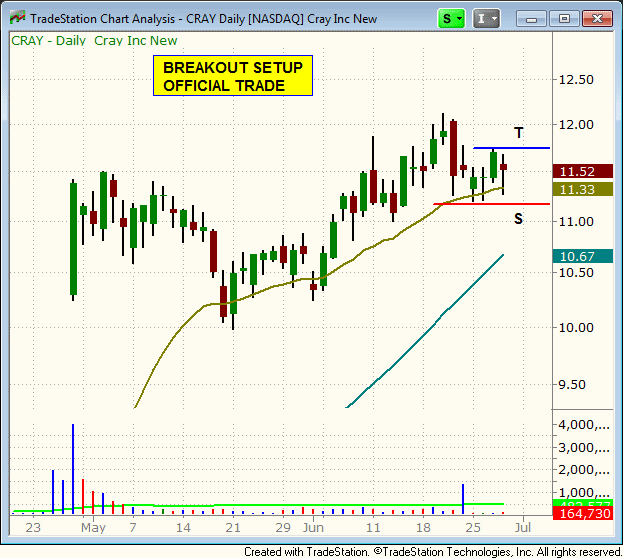
CRAY is consolidating in a tight range about 5% off the 52-week high. We like how the price action has held above the 20-day EMA since gapping up in late April. Another plus is the light volume over the past few days as the price action chopped around. The buy entry is over the two-day high.

Yesterday’s late reversal was a bullish sign for the market. Although the timing model is on a sell signal we are simply one follow through day away from generating a buy signal. With this in mind, we are willing to establish a few long positions with reduced share size, risking about $200 per trade. Due to yesterday’s action, we are closing open short positions due to the lack of follow through since the entry to minimize losses and/or lock in gains.
If you are a new subscriber, please e-mail [email protected] with any questions regarding our trading strategy, money management, or how to make the most out of this report.
relative strength watchlist:
Our Relative Strength (or RS) Watchlist makes it easy for subscribers to import data into their own scanning software, such as Tradestation, Interactive Brokers, and TC2000. This list is comprised of the strongest 100 (or so) stocks in the market over the past six to 12 months. The scan is updated every Sunday, and this week’s RS Watchlist can be downloaded by logging in to the Members Area of our web site.