market timing model:
Buy – Signal generated on the close of November 23 (click here for more details)
today’s watchlist (potential trade entries):

Having trouble seeing the open positions graphic above? Click here to view it directly on your web browser instead.
open positions:
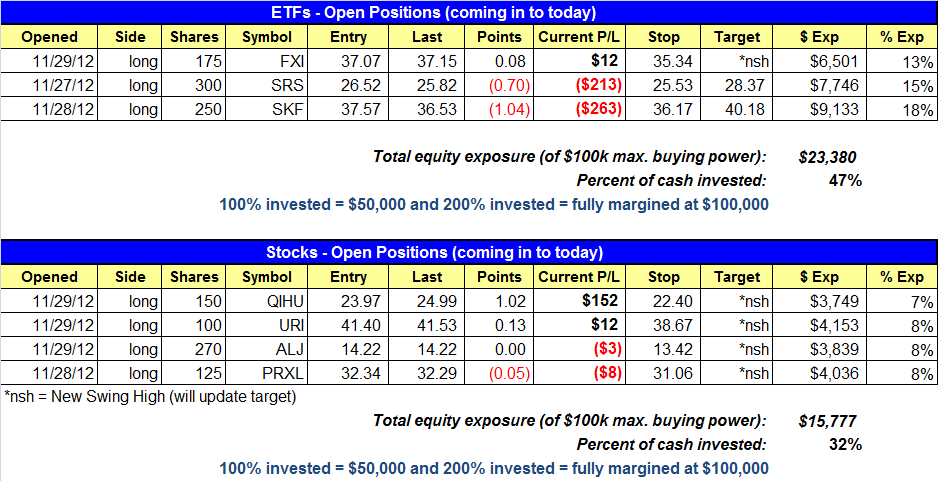
Below is an overview of all open positions, as well as a report on all positions that were closed only since the previous day’s newsletter. Net P/L figures are based on two separate $50,000 model portfolios (one for ETFs and one for stocks). Changes to open positions since the previous report are listed in pink shaded cells below. Be sure to read the Wagner Daily subscriber guide for important, automatic rules on trade entries and exits.

Having trouble seeing the open positions graphic above? Click here to view it directly on your web browser instead.
closed positions:

Having trouble seeing the closed positions graphic above? Click here to view it directly on your web browser instead.
ETF position notes:
- No trades were made.
stock position notes:
- Removed $ALKS from the watchlist and added $FAF.
ETF and broad market commentary:
Stocks concluded the month of November in uneventful fashion last Friday, as the main stock market indexes drifted in a tight, sideways range throughout the entire day. The S&P 500 ($SPX), Dow Jones Industrial Average ($DJIA), and Nasdaq Composite ($COMPQ) all closed within 0.1% of the flatline. Small and mid-cap stocks edged fractionally higher. The major indices also closed near the middle of their intraday ranges, as traders showed apathy into the close.
Last Friday was an “inside day,” meaning the intraday trading ranges of the main stock market indexes (distances from the lows to highs of the day) were completely contained within the previous day’s respective trading ranges. On a technical level, this type of price action is frequently indicative of normal, healthy price consolidation following a rally. However, it’s notable that total volume in the NYSE rose 10%, while turnover in the Nasdaq jumped 16% above the previous day’s level.
When stocks are trading near their short-term highs while in a countertrend bounce off the lows, the presence of higher volume without accompanying price gains is considered negative because it hints at stealth selling into strength among banks, mutual funds, hedge funds, and other institutions. Nevertheless, one or two rounds of institutional profit taking after stocks have formed a “V” bottom off their lows is normal, and can easily be absorbed by a healthy market.
The potential challenge as we enter the final month of 2012 is that stocks must still contend with an abundance of overhead supply and technical resistance levels among the major indices. “Overhead supply” is formed by traders who formerly bought near the highs, but did not quickly cut their losses when stocks headed south. Still holding on to these losing positions, these individuals are typically eager to sell into strength of any further broad market gains, simply in the hope of “just breaking even” (hope is a very dangerous emotion for traders). This selling pressure formed by the overhead supply is what makes it difficult for confirmed downtrending markets to fully reverse into a new uptrend, at least without a substantial period of correction by time (“back and fill” price action).
With the Nasdaq and S&P 500 still trading below their September 2012 highs by approximately 5% and 3%, only a sudden surge in institutional buying (high volume) would enable the broad market to rally all the way to new highs in a short period of time. On the daily chart of S&P 500 SPDR ($SPY), a popular ETF proxy for the benchmark S&P 500 Index, we have annotated the key resistance and support levels to pay attention to in the coming days:

Overall, the month of November was basically a scratch. The main stock market indexes printed significant losses in the first half of the month, then reversed to recover those losses in the latter half of the month. In the end, prices were little changed in November. Despite this, the accurate signals received from our market timing model enabled us to score a decent round of gains in November by swing trading on both sides of the market (updated stats through November 2012 will soon be posted on our website).
Since the last two weeks of the month of December are typically dead in terms of trading volume, there are really only two more “tradeable” weeks remaining in 2012. Therefore, it is fair to say the overall price action of the broad market over the next several days could easily set the tone for the remainder of the year, specifically whether or not the S&P 500 manages to convincingly move back above its 50-day moving average, AS WELL AS the substantial horizontal price resistance.
Our market timing model remains in “buy” mode, as it has been since reversing from “sell” mode on November 23. We still have two short positions in our model trading portfolio, but the majority weighting of our swing trades (combining ETF and individual stock positions) remains on the long side of the market. Unless the model shifts into “confirmed buy” mode, there is nothing wrong with maintaining a bit of short exposure in ETFs with relative weakness to the broad market (or relative strength for inversely correlated “short ETFs”). In the event of a sudden return of a bear attack, which could swiftly lead to a resumption of the dominant downtrend (which stocks have technically not reversed yet), maintaining a small allocation of bearish exposure helps to reduce risk and volatility in our model portfolio. Yet, if our market timing system suddenly generates the necessary signals to shift to a new “confirmed buy” mode, all bets would immediately be off on the short side of the market, and exposure on the long side would be further increased. Trading objectively with our rule-based system for market timing removes the guesswork and emotion out of knowing when to be in or out of the markets, and on which side to be on.
As we enter today, last Friday’s new swing trade setup in iShares Poland Index ($EPOL) remains on the ETF Watchlist as an “official” buy setup, with exactly the same parameters. There are also no changes to the stops or target prices of our other three open positions at this time ($FXI, $SRS, and $SKF). We continue scanning for new ETF trading opportunities to add to our watchlist, such as iShares Philippines ($EPHE) on a pullback to support. However, remember to let the ideal trade setups with a positive reward-risk ratio come to you, as opposed to forcing half-baked swing trade entries just for the sake of action. If action is all you’re looking for, go to Vegas and you’ll surely get your fix. But if you’re serious about consistently raking in swing trading profits over the long-term, you must develop the patience and discipline to follow the proven swing trading system taught every day in this newsletter.
stock commentary:
We removed ALKS from today’s watchlist but will continue to monitor the action. The NTE buy limit order is still live and could potentially trigger on a quick undercut of the two-day low. Although we have not seen much follow through in open positions, these trades are not in bad shape and could easily run higher this week, especially if the market gets going.
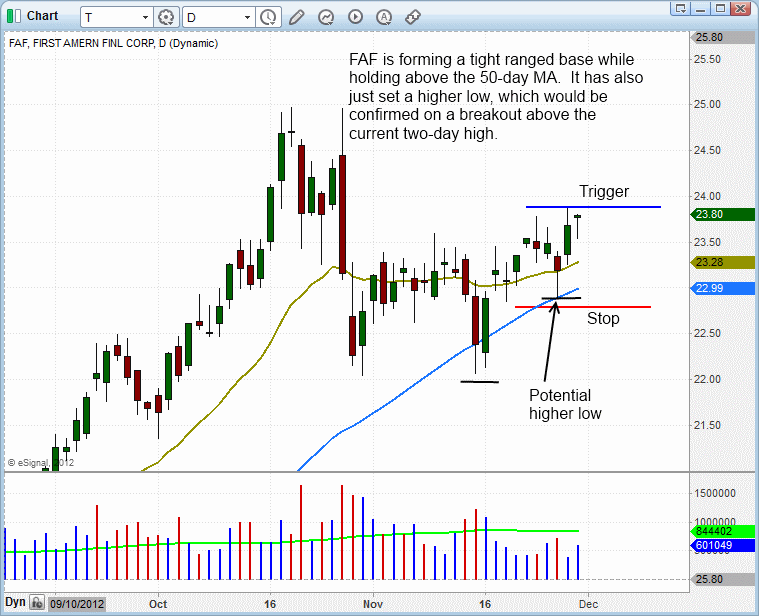
We added one new setup for today’s watchlist in $FAF. The daily chart below shows the tight basing action above the 50-day MA. The 20-day EMA is above the 50-day MA and both averages are pointing up. The recent test of the 50-day MA could turn into the first higher low within the base. We are looking for a 15% run up over the next two weeks. As with all open positions, our size is still at 1/3 of max size at 8%.

We do not want to add much more long exposure until we see more confirmation of a bull market, so $FAF will be the last new setup this week. There seems to be quite a bit of negative sentiment in the media with all the “finacial cliff” coverage the past two weeks. Negative sentiment by itself is not something we normally get excited about; however, when we add bullish price action in stocks from the top 40 industry groups in the mix….then we have something.
If you are a new subscriber, please e-mail [email protected] with any questions regarding our trading strategy, money management, or how to make the most out of this report.
relative strength combo watchlist:
Our Relative Strength Combo Watchlist makes it easy for subscribers to import data into their own scanning software, such as Tradestation, Interactive Brokers, and TC2000. This list is comprised of the strongest stocks (technically and fundamentally) in the market over the past six to 12 months. The scan is updated every Sunday, and this week’s RS Combo Watchlist can be downloaded by logging in to the Members Area of our web site.