market timing model:
Buy – Signal generated on the close of August 16 (click here for more details)
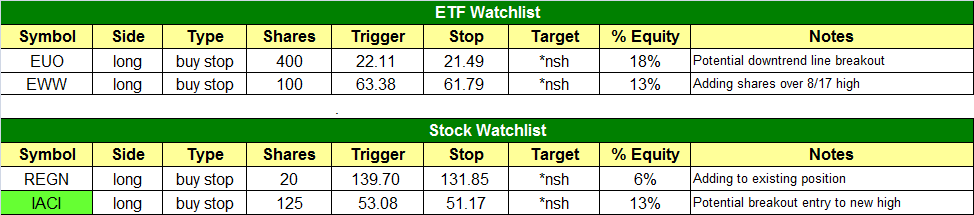
today’s watchlist (potential trade entries):
Having trouble seeing the open positions graphic above? Click here to view it directly on your web browser instead.
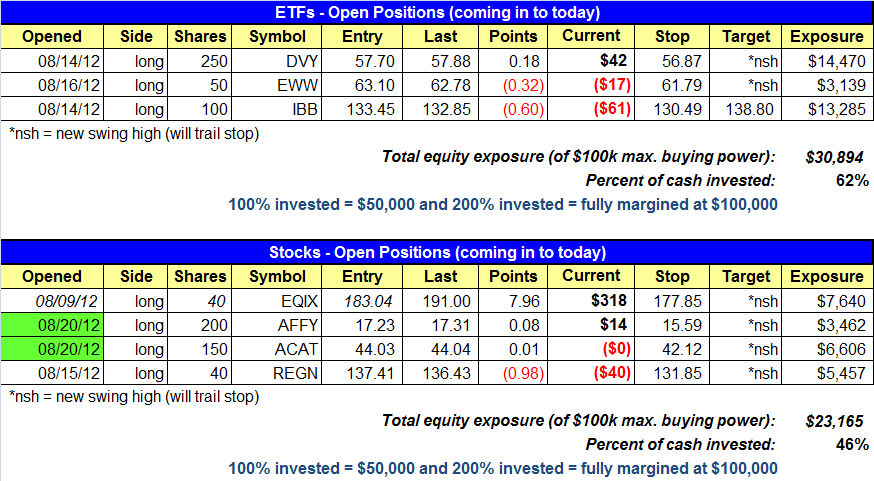
open positions:
Below is an overview of all open positions, as well as a report on all positions that were closed only since the previous day’s newsletter. Net P/L figures are based on two separate $50,000 model portfolios (one for ETFs and one for stocks). Changes to open positions since the previous report are listed in pink shaded cells below. Be sure to read the Wagner Daily subscriber guide for important, automatic rules on trade entries and exits.
Having trouble seeing the open positions graphic above? Click here to view it directly on your web browser instead.
closed positions:

Having trouble seeing the closed positions graphic above? Click here to view it directly on your web browser instead.
ETF position notes:
- No new ETF trades were entered, and there are no changes to the stops of our open ETF positions. EUO and EWW (adding to existing position) remain on our watchlist going into today.
stock position notes:
- AFFY and ACAT buy entries triggered from yesterday’s watchlist.
ETF and broad market commentary:
After shaking off a rough start in the first hour of trade, the broad market grinded higher throughout the rest of the day, causing most of the main stock market indexes to close at the flat line. The S&P 500 Index ($SPX), Nasdaq Composite ($COMPQ), and Dow Jones Industrial Average ($DJIA) were all unchanged on the day. Small and mid-caps retraced a bit of their previous day’s gains, as both the S&P MidCap 400 Index ($MID) and small-cap Russell 2000 Index ($RUT) dipped 0.4%. The large-cap Nasdaq 100 Index ($NDX) eked out a gain of 0.1%. All the major indices that were flat settled near their intraday highs, hinting at institutional support.
Turnover receded across the board, which was fine considering the intraday price action of stocks. Total volume in the Nasdaq was 16% lighter than the previous day’s level, while trade in the NYSE eased 11%. As has been the case throughout most of this month, total volume in both exchanges was below 50-day average levels. Declining volume fractionally edged out advancing volume in the NYSE. In the Nasdaq, declining volume exceeded advancing volume by a modest margin of just under 3 to 2. Drilling down for a closer look at yesterday’s market internals, it is positive to note that volume was also tracking 20% lighter during the morning decline. Therefore, even if the main stock market indexes had closed negative, the S&P and Nasdaq still would have likely averted “distribution days” due to volume being lighter.
The S&P 500, Dow Jones Industrial Average, and Nasdaq 100 indices have reached pivotal “make it or break it” levels that may lead to a tug-of-war between bulls and bears and a bit of volatility in the coming days. Specifically, each of these indexes are now testing key resistance of their multi-year highs that were formed in March or April of this year. Let’s start with a look at the daily chart pattern of the S&P 500 SPDR ($SPY), a popular ETF trading proxy for the benchmark S&P 500 Index:
 testing resistance of its 52-week high")
Over the past several days, notice that $SPY has been toying with resistance of its April 2 high (the dashed horizontal line), which also correlates to the 4-year high of the benchmark ETF. The PowerShares QQQ Trust ($QQQ), an ETF trading proxy for the Nasdaq 100 index, has a very similar daily chart pattern:
 testing resistance of its 52-week high")
The Dow Jones SPDR ($DIA), which tracks the performance of the Dow Jones Industrial Average, is now testing a band of resistance between the $132.50 to $133 area. As with $SPY and $QQQ, a breakout above this horizontal price resistance would cause $DIA to move to its highest level since mid-2008:
 testing resistance of its 52-week high")
When an index, ETF, or stock approaches the level of its 52-week high (or multi-year high), the price action often becomes a volatile tug-of-war for at least a few days. This occurs when the bulls are fight for control over long-term investors who previously bought at higher prices, and whom are therefore selling into strength of the rally in the hope of “just breaking even” on their original position. However, when a convincing, high volume breakout to a new 52-week high eventually occurs, the price of the index, ETF, or stock usually continues much higher in the near and intermediate-term because there becomes a complete lack of overhead supply (resistance) to hold the price down. This is the reason why one of our main swing trading strategies is to buy ETFs and stocks breaking out of solid bases of consolidation to new 52-week highs. Also, remember that our new ETF and stock screener (currently free for all traders) is preprogrammed to quickly and easily find these types of Potential Breakouts.
The obvious question on the minds of traders and investors right now is whether or not the main stock market indexes and these broad-based ETFs possess the necessary bullish momentum to break out to new multi-year highs in the coming days. Obviously, nobody really knows. However, don’t forget that markets have a tendency to do what the least number of market participants expect, AND at a time when they least expect it. Therefore, the greater the public opinion that the major indices will stall near these resistance levels and reverse back down, the more likely these indexes will actually surge to fresh multi-year highs. This is why following the mentality of “the herd” is usually a losing proposition.
Although the talking heads of the financial media place great daily emphasis on the direction of the S&P 500, Nasdaq Composite, and Dow Jones Industrial Average, we suggest active swing traders to not pay much attention to the actual price action of the broad-based indexes (leave that to the “buy-and-pray” long-term investors). Rather, what really matters right now is the performance of leading individual growth stocks because these stocks lead the broad market (not the other way around). So, this being the case, how are leading stocks acting right now? Just fine. The strongest stocks in the market are already breaking out to new 52-week highs and holding, which increases the odds of the major indices eventually following suit (although a moderate pullback or “shakeout” in the interim would not be surprising).
We showed you the three ETF charts above, each indicating pivotal price resistance of their 52-week highs, simply because the public’s perception of the importance of these indexes does indeed have a bearing on the broad market’s near-term direction. However, we challenge you not to care too much about whether these indexes break out or not. As long as our market timing system remains in “buy” mode, we will continue to focus our efforts exclusively on buying the strongest stocks and ETFs in the market as they break out of consolidation or pull back to support. If our timing model next receives the necessary proprietary signals to shift from “buy” to “confirmed buy” mode (click here for a summary of the 5 different modes), we will continue doing the same thing we are doing now, but just with higher share size and a greater quantity of positions (more exposure).
So far, the open ETF and stock positions of our model trading portfolios are acting just fine. Although the light seasonal volume has been keeping upside momentum in check,2 of our 4 open stock positions jumped to new 52-week highs yesterday, even as the major indices were unchanged. Overall, we remain well-positioned to profit from continued bullish momentum in the market, while still maintaining our firm, protective stop prices (as always) in case things don’t go as planned.
stock commentary:
We have one new buy setup on today’s stock watchlist ($IACI), which is forming the handle portion of a “cup with a higher handle” pattern. Since the handle portion is above the high of the left side of the base, it is a higher handle. If the handle was below the high of the left side of the base, the pattern would be a normal “cup and handle” like $ACAT.
")
With $AFFY and $ACAT triggering for entry yesterday, our model stock portfolio has about 45% of the cash invested in the market. As long as our open positions act well and new buy setups emerge, we will continue adding more exposure. $AFFY broke out to close at a new 52-week high yesterday. $EQIX (which we have been long since August 9) surged to finish at a new all-time high. After our winning positions start surpassing a 2 to 1 reward-risk ratio, we will be looking to tighten stops in order to lock in gains along the way.
If you are a new subscriber, please e-mail [email protected] with any questions regarding our trading strategy, money management, or how to make the most out of this report.
relative strength combo watchlist:
Our Relative Strength Combo Watchlist makes it easy for subscribers to import data into their own scanning software, such as Tradestation, Interactive Brokers, and TC2000. This list is comprised of the strongest stocks (technically and fundamentally) in the market over the past six to 12 months. The scan is updated every Sunday, and this week’s RS Combo Watchlist can be downloaded by logging in to the Members Area of our web site.