BUY
today’s watchlist (potential trade entries):

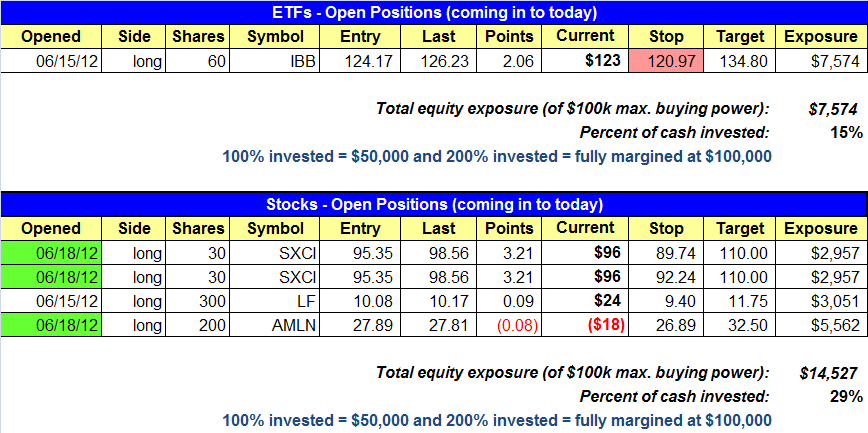
open positions:
Below is an overview of all open positions, as well as a report on all positions that were closed only since the previous day’s newsletter. Net P/L figures are based on two separate $50,000 model portfolios (one for ETFs and one for stocks). Changes to open positions since the previous report are listed in red shaded cells below. Be sure to read the Wagner Daily subscriber guide for important, automatic rules on trade entries and exits.

Having trouble seeing the open positions graphic above? Click here to view it directly on your web browser instead.
closed positions:

Having trouble seeing the closed positions graphic above? Click here to view it directly on your web browser instead.
ETF position notes:
- No trades were made.
stock position notes:
- Longs SXCI and AMLN triggered.
ETF and broad market commentary:
Stocks ended the session mixed, as volume faded following Friday’s options expiration. The Nasdaq and the S&P MidCap 400 put in the best showings as both indices tacked on 0.8%. The small-cap Russell 2000 added 0.2% while the S&P 500 managed a slim 0.1% gain. The Dow Jones Industrial Average was the only loser on the session. The blue chip index faded 0.2%.
Internals ended the day mixed on Monday. As might be expected in the wake of options expiration, turnover fell across the board. On the Nasdaq volume fell 19.1% and on the NYSE it fell 24.8%. The NYSE saw declining volume hold the upper hand by a factor of 1.1 to 1, while on the Nasdaq, advancing volume outpaced declining volume by 2.0 to 1.
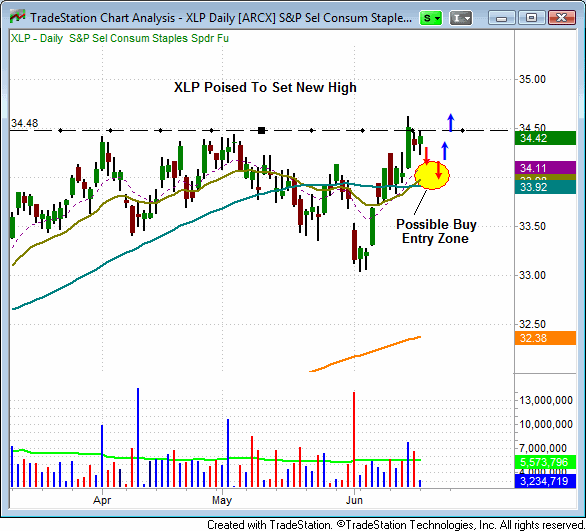
The S&P Select Consumer Staples SPDR ETF (XLP) has been one of the strongest ETFs in the market over the past two months. Last Thursday, on a burst of volume, XLP unsuccessfully attempted to break out of its three month trading range. Nonetheless, this ETF is now poised to see a new 52-week high and could provide a buying opportunity either on a pullback or on a volume fueled move above the three day high ($34.65). Because obvious breakouts above recent swing highs often fail, ideally we would like to see XLP pull back and form a reversal candle near its 20-day and 50-day moving averages. The high of the reversal candle would then serve as the buy pivot for a possible long entry. We will be monitoring XLP closely as a potential long candidate.

Our open position in IBB performed well yesterday. The next key resistance for IBB is $126.90. Above this mark, IBB should see a flurry of buying activity, as it will be setting a fresh 52 week high. Now that we have a buy signal in the market, we now need confirmation that the market is in full blown buy mode. Over the next several sessions we want to see a follow through day, where the market posts a significant accumulation day, confirming that market bulls are in control. However, should we see a big distribution day on the heels of the current buy signal, there is a strong likelihood that the market is not yet ready to move to higher ground. Just as the market was only one day removed from a buy signal last week, we are now potentially just one day removed from a sell signal this week. Consequently, we are keeping our position size in check.
stock commentary:
Both long setups triggered yesterday, giving us three open long positions and 29% exposure. SXCI is listed twice in the open positions section due to the split stop.
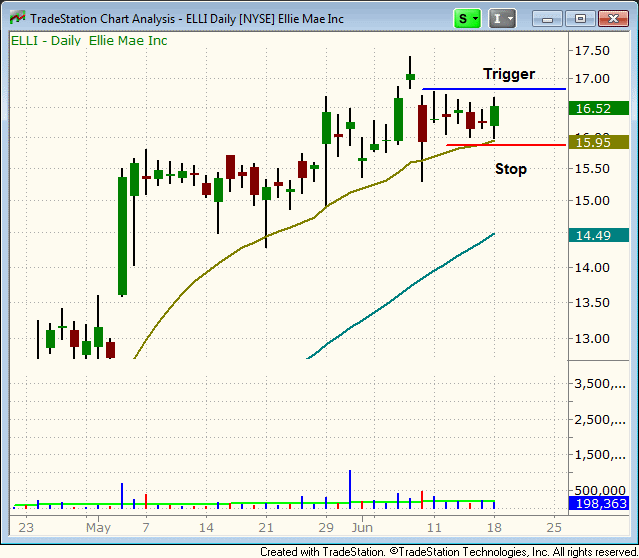
We added ELLI to today’s watchlist as a potential breakout above the six day high with a tight stop beneath yesterday’s low.

Until the timing model generates a “confirmed buy signal” we plan on keeping our exposure in the 30-60% range. The goal is to slowly build up our exposure and build on success. Patience is key right now, as the major averages deal with the declining 50-day MA.
If you are a new subscriber, please e-mail [email protected] with any questions regarding our trading strategy, money management, or how to make the most out of this report.
relative strength watchlist:
Our Relative Strength (or RS) Watchlist makes it easy for subscribers to import data into their own scanning software, such as Tradestation, Interactive Brokers, and TC2000. This list is comprised of the strongest 100 (or so) stocks in the market over the past six to 12 months. The scan is updated every Sunday, and this week’s RS Watchlist can be downloaded by logging in to the Members Area of our web site.