Confirmed Buy– Signal generated on the close of January 22 (click here for more details)
today’s watchlist (potential trade entries):

Having trouble seeing the open positions graphic above? Click here to view it directly on your web browser instead.
open positions:
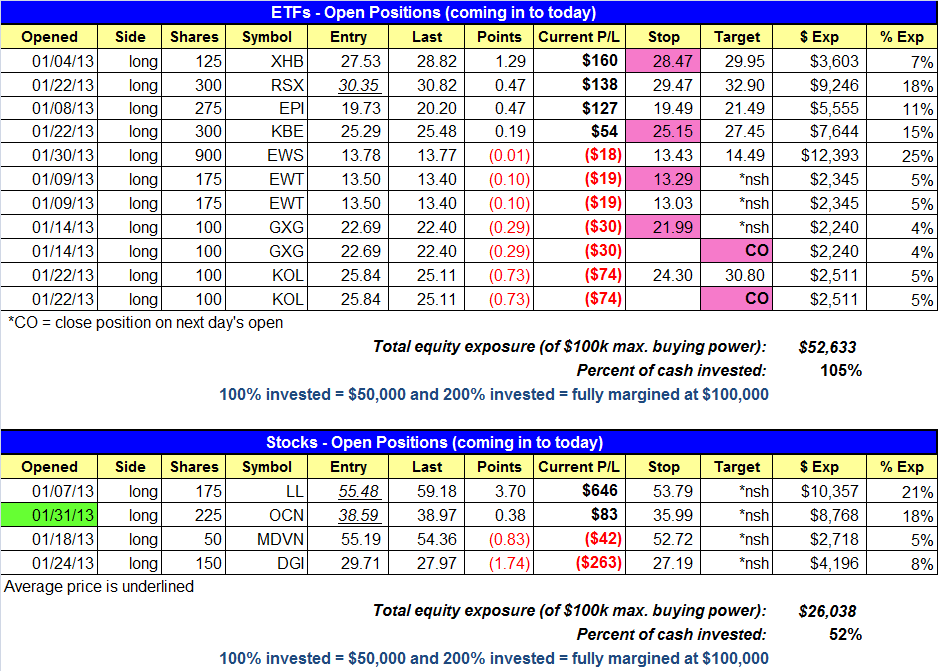
Below is an overview of all open positions, as well as a report on all positions that were closed only since the previous day’s newsletter. Net P/L figures are based on two separate $50,000 model portfolios (one for ETFs and one for stocks). Changes to open positions since the previous report are listed in pink shaded cells below. Be sure to read the Wagner Daily subscriber guide for important, automatic rules on trade entries and exits.
Having trouble seeing the open positions graphic above? Click here to view it directly on your web browser instead.
closed positions:

Having trouble seeing the closed positions graphic above? Click here to view it directly on your web browser instead.
ETF position notes:
- $RWO sell stop triggered and we are out with a scratch gain. We canceled the $GXG buy setup.
stock position notes:
- $OCN buy stops triggered.
ETF, stock, and broad market commentary:
Stocks finished in mixed territory, with small and mid-cap stocks gaining ground while large cap indices closed lower. Losses on the Dow Jones and S&P 500 were limited to the 0.3% to 0.4% range, but both averages did close at or near the lows of the day for the second day in a row. Turnover increased on both exchanges, registering a bearish distribution day for the S&P 500. With the recent stalling action at 1,500 and Thursday’s distribution, the rally in the S&P has lost some momentum. We are not calling the rally dead, but if the distribution days cluster over a short period of time we will be forced to move into cash.
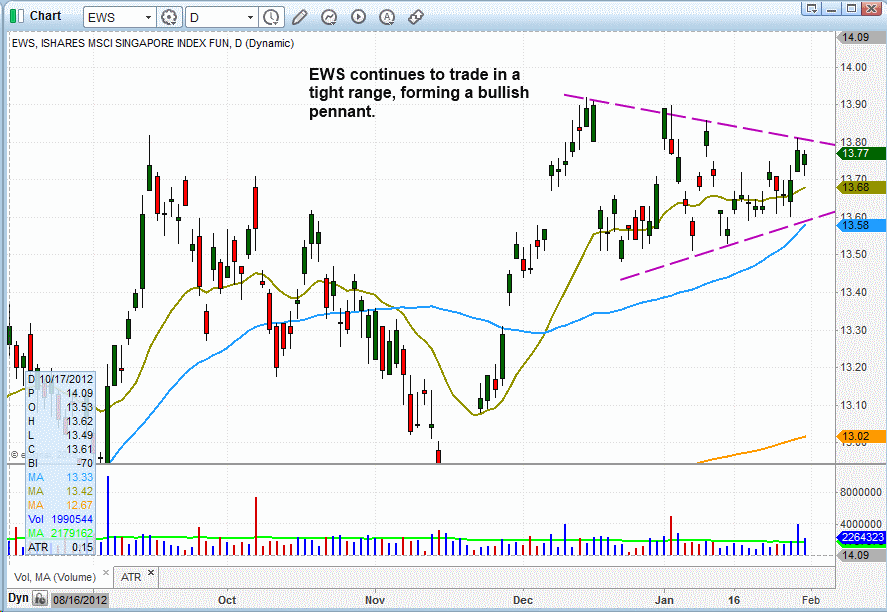
Due to yesterday’s distribution, we decided to tighten up stops on several positions and reduce share size in our weaker holdings ($EWT, $GXG, and $KOL). We plan to sell half of $GXG and $KOL on the open simply to reduce our size. We also have a very tight stop in place on half of $EWT. Stops in $RSX, $EPI, and $EWS are unchanged, as we do not mind holding these positions during a market pullback.
When swing trading with the trend, we feel that it is an absolute must to focus on reacting to and not predicting market action. So, if we change our mind about a position or stop placement, it is because we are constantly trying to manage risk to keep in line with the market. The goal is to always go with the flow and process market information to avoid sticking to opinions. The only good stocks or ETFs are the ones that go up.
The bullish pennant formation in $EWS is still intact and could potentially breakout any day now.
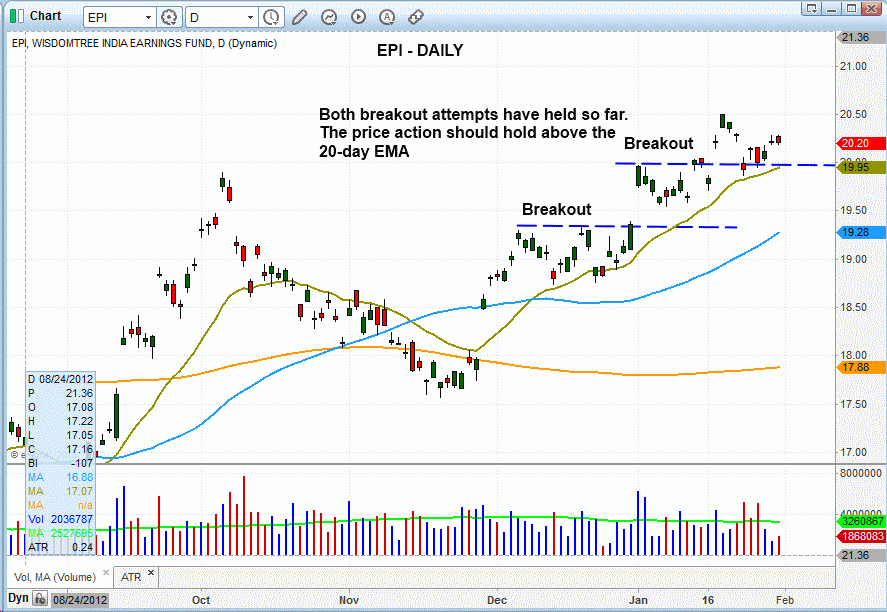
$EPI pulled back to and held the prior breakout pivot at 20.00. We plan to hold as long as the price action remains above the 20-day EMA minus some wiggle room.
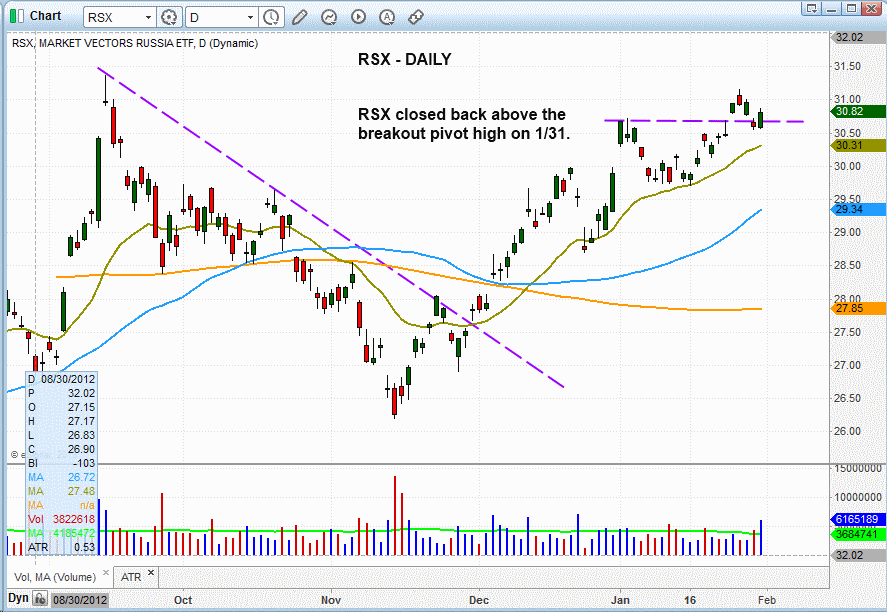
Like $EPI, $RSX recently pulled back to support of the breakout pivot and held. As with $EPI, we are willing to stick with $RSX if it can hold the 20-day EMA.
There are no new setups for today in the stock or ETF portfolio.
On the stock side, we added one new position in $OCN. The price action exploded higher after our first entry but failed to hold above the breakout pivot at 39.25. The action recovered a bit in the afternoon, allowing $OCN to close off the lows of the day.
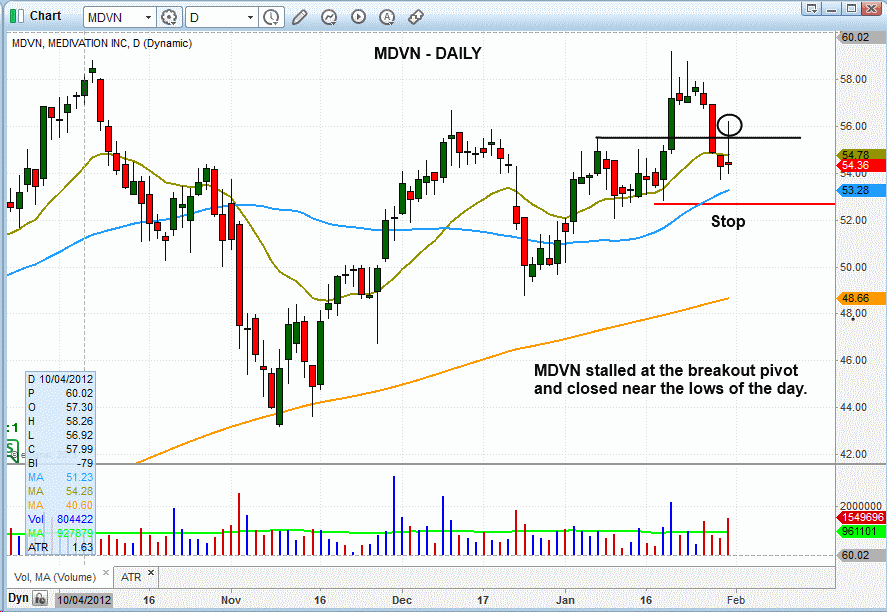
$MDVN ran higher earlier in the day but stalled out just above the prior breakout level. The afternoon selloff erased all gains as $MDVN closed near the lows of the day. All we can do now is obey the stop.
With our stock exposure at 50% we are comfortable holding on to current positions without tightening up stops for now. $DGI is the only position that is in trouble, and there isn’t much we can do now other than to obey the stop.
If you are a new subscriber, please e-mail [email protected] with any questions regarding our trading strategy, money management, or how to make the most out of this report.
relative strength combo watchlist:
Our Relative Strength Combo Watchlist makes it easy for subscribers to import data into their own scanning software, such as Tradestation, Interactive Brokers, and TC2000. This list is comprised of the strongest stocks (technically and fundamentally) in the market over the past six to 12 months. The scan is updated every Sunday, and this week’s RS Combo Watchlist can be downloaded by logging in to the Members Area of our web site.