market timing model:
Neutral – Signal generated on the close of August 2 (click here for more details)
today’s watchlist (potential trade entries):
Having trouble seeing the open positions graphic above? Click here to view it directly on your web browser instead.
open positions:
Below is an overview of all open positions, as well as a report on all positions that were closed only since the previous day’s newsletter. Net P/L figures are based on two separate $50,000 model portfolios (one for ETFs and one for stocks). Changes to open positions since the previous report are listed in red shaded cells below. Be sure to read the Wagner Daily subscriber guide for important, automatic rules on trade entries and exits.
Having trouble seeing the open positions graphic above? Click here to view it directly on your web browser instead.
closed positions:
Having trouble seeing the closed positions graphic above? Click here to view it directly on your web browser instead.
ETF position notes:
- No trades were made.
stock position notes:
- Per yesterday’s watchlist, ONXX triggered for buy entry. As mentioned in the ETF commentary below, the biotech sector has been acting well, so trading a stock within the same sector increases our odds of a successful trade. With a “neutral” market timing model, we have initially entered with only partial share size in order to control risk. If we get a confirmed “buy” signal and the stock acts well, we will consider adding to the position.
ETF and broad market commentary:
Stocks ended Wednesday’s session mixed, amidst relatively flat trade. As we commonly see in August, when much of Wall Street is relaxing in the Hamptons, volume was light as well. The market was noncommittal throughout the day, as all the major indices seesawed in a narrow range throughout the session before settling near the flat line. The Nasdaq Composite eased 0.2%, while the small-cap Russell 2000 similarly edged 0.1% lower. The Dow Jones Industrial Average, S&P 500 and S&P MidCap 400 all eked out gains of 0.1%.
Market internals ended the session mixed. Volume on the Nasdaq was 1.4% lighter than the previous day’s level. Turnover in the NYSE eased 12.3%. However, despite the slower pace of trade, advancing volume outpaced declining volume on both exchanges. By the closing bell, the ratio of advancing volume to declining volume was 1.5 to 1 on the NYSE and 1.6 to 1 on the Nasdaq. Overall, yesterday’s broad market price action could be considered a consolidation day, so not much could be gleaned from its lethargic price and volume action.
Presently pulling back modestly off its all-time high, the iShares Nasdaq Biotechnology ETF ($IBB) has been showing clear relative strength to the broad market. Since snapping back above support of its 20-day EMA on August 3rd, IBB has been consolidating in a tight range for the past four days. Now, IBB offers a possible swing trade buying opportunity on a breakout above that four-day high of $134.32, with a protective stop below the 4-day low. Subscribers should note our exact entry and exit prices for this trade setup in “today’s watchlist” section of this newsletter above. The daily chart of IBB shows the trade setup:
While the IBB swing trade setup above is on a pullback off its recent highs, the United States Natural Gas ETF ($UNG) is setting up as a trend reversal play. Rallying off its lows for the past four months, UNG rose all the way back to resistance of its 200-day MA on July 31, which not surprisingly led to a subsequent pullback. However, the price action is still holding firm near short-term support of its 20-day EMA, and could present a quick momentum-based buying opportunity on a move above its two-day high of $20.49. If it moves above that price, UNG could break out above its 200-day MA on the next test of that pivotal level of long-term price resistance. As such, UNG also appears for subscribers on “today’s watchlist” as a potential buy entry. However, note that because this setup is a trend reversal play, rather than an ETF trading near its high, we are only planning to enter as a very short-term trade (2 to 5 days) to capture a swift, momentum-driven pop (if it trades through our trigger price). Because it is a commodity ETF, we also like the low correlation to the direction of the main stock market indexes. The UNG setup is shown below:
Although the broad-based averages are holding firm, leading individual stocks continue to suffer. During yesterday’s session, it was $PCLN that got slammed. After the close, it was an earnings-related hit to $MNST, which shed nearly 10% in after-hours trade. Eventually, new leaders will begin to emerge, which will be the missing ingredient to a legimitately strong market that pulls many ETFs along with it. But until then, we will focus on selectively and only lightly trading ETFs with clear relative strength and/or a low correlation to the direction of the stock market. Remember that our market timing model remains in neutral, so we are not yet in a hurry to be aggressive in the market. If the current rally is for real, there will be plenty of time to take advantage of buying opportunities throughout the rest of the year.
stock commentary:
There are two new stocks on our watchlist for potential buy entry today (CBM and EQIX). Due to our market timing model being in “neutral” mode, both are being targeted with reduced share size.
Originally listed as a stock watchlist candidate in our August 6 issue, and currently showing up as a “Pullback” candidate on the MTG Stock Screener, EQIX may now be poised to break out above the high of its 4-day consolidation and rally to a new high. The August 2 pullback to near-term support of its 20-day EMA, combined with the “shakeout” action of August 7, increases the odds of a successful breakout attempt. Volume has also declined and been lighter than average since the July 26 post-earnings breakout. That is bullish during a pullback and subsequent consolidation because it indicates traders are not selling into strength of the preceding breakout. The trade setup is illustrated on the daily chart below:
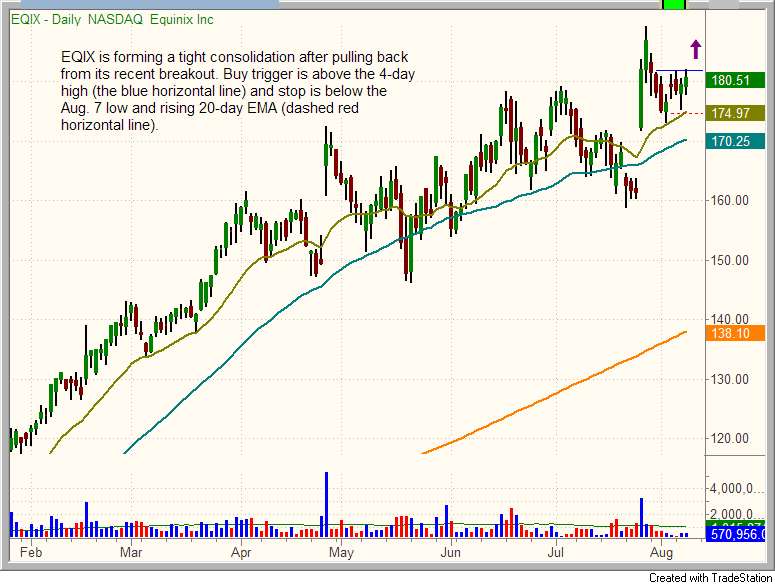
If you have a smallish trading account, don’t be concerned about the relatively high share price of EQIX. The best stocks are usually expensive for good reason. Even though the setup may be listed with small share size, expensive stocks make larger point moves in both directions. By reducing share size of the setup, our capital risk (based on the stop price) is the same as any other setup. As such, one should not view this setup any differently than buying more shares of a cheaper stock.
Many of the stocks presently on our radar screen for pullback or breakout entry are scheduled to report quarterly earnings in the near future. Since we avoid buying in front of earnings reports (akin to gambling), we are holding off on those setups for now, but are maintaining a watchful eye. Furthermore, as mentioned in this blog post from yesterday, there are good reasons why we do not yet have much conviction for swing trading on the long side. Nevertheless, we will still take a shot at the best setups with a positive reward-risk ratio, albeit with smaller share size and correspondingly lower risk.
If you are a new subscriber, please e-mail [email protected] with any questions regarding our trading strategy, money management, or how to make the most out of this report.
relative strength combo watchlist:
Our Relative Strength Combo Watchlist makes it easy for subscribers to import data into their own scanning software, such as Tradestation, Interactive Brokers, and TC2000. This list is comprised of the strongest stocks (technically and fundamentally) in the market over the past six to 12 months. The scan is updated every Sunday, and this week’s RS Combo Watchlist can be downloaded by logging in to the Members Area of our web site.