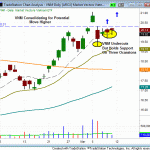
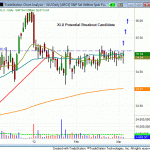
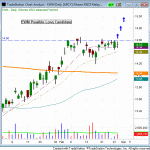
Since setting a new swing high on March 5th, the Market Vectors Vietnam ETF (VNM) has pulled back and been consolidating at its 10-day EMA. We often look to the 10-day MA as a key support level when an ETF is in a strong uptrend. A volume assisted move back above the four day high of $20.21 could present a buying opportunity in this ETF.

Continue Reading...

The iShares Russell 2000 Index ETF (IWM) is now at a critical crossroad, as it approaches resistance of both its 20-day EMA and the lows of its prior trading range. The small-cap index needs to get back into the prior trading range over the next few sessions or it could be in jeopardy of making another move lower. However, also notice on the weekly chart (second chart below) that IWM has, thus far, formed a nice reversal on the week. The weekly charts for all of the other indices are also showing the same reversal pattern. We would like to see the Russell “catch up” to the other indices as this would increase the odds for another move higher. Looking at different timeframes is important when analyzing market conditions.

Continue Reading...

Since January of this year, the S&P Select Utilities SPDR Fund (XLU) has been consolidating along its 20-day EMA in a tight range. Yesterday, for the second time in four sessions, XLU formed a distinct reversal candle, as it undercut its 20-day EMA but recovered to close near session highs. A move back above yesterday’s high of $35.11 could provide a buy entry trigger for this ETF. We are placing XLU on the watchlist. Trade details are posted in the watchlist section of the newsletter.

Continue Reading...

Given Friday’s selling pressure, a review of the major indices is in order (see charts below). Recently, the Russell 2000 has demonstrated the most relative weakness. On Friday, the small-cap index lost key support at 811 and now appears headed for the 787 market, which corresponds with the 50-day moving average. If the Nasdaq is going to continue its uptrend, it should hold support at 787. In fact, a pullback into the 50-day MA should offer a buying opportunity in the small-cap Russell 2000.

Continue Reading...

Over the past two sessions, the iPath Dow Jones AIG Commodity ETN (DJP) has formed back to back reversal candles, as it has tested support of its 10-day and 20-day moving averages. A move above the two day high of $44.69 could present a buying opportunity in this ETF. We are placing DJP on the watchlist. Trade details can be found in the watchlist portion of the newsletter.

Continue Reading...

The Russell 2000 Index ($RUT) is in danger of losing support at 811. If the Russell cannot hold support at this mark, the next significant support level is near 785. Tomorrow is an important day for the small-cap index, as it will likely tell us whether or not we will see a more protracted move lower in the broad market. If the Russell holds up, it may just take the market a couple of days to stabilize before moving higher. If the Russell loses support then we wouldn’t be surprised to see a three to five percent correction in the broad market.

Continue Reading...

Since rallying above its 200-day MA in early February, the iShares MSCI Malaysia Index ETF (EWM) has been consolidating along its 10-day MA and 20-day EMA. This type of “base building” action is important, as it serves as the launching pad for the next potential move higher. A volume fueled move above the three day high of $14.60 could provide a buying opportunity in EWM.

Continue Reading...

Yesterday, on a spike in volume, the Direxion Daily Semiconductor 3x Bull ETF (SOXL) formed a reversal candle for the second time in four days, as it tested support below its 20-day EMA. Further, this price action occurred on an uptick in volume and SOXL closed in the upper 40% of the day’s range. A rally above the four day high of $41.47 could provide a buy entry trigger for SOXL. We will be monitoring SOXL carefully for a potential long entry.

Continue Reading...