Our Story
From a proprietary trading desk to America's first IEAC-accredited trading education firm — this is the journey of Morpheus Trading Group and its founder, Deron Wagner.
Where It All Began
In 2002, professional trader Deron Wagner made a decision that would change the lives of over 70,000 traders: he decided to teach.
After years as a proprietary trader at major U.S. trading firms — where he not only traded firm capital but trained other professional traders — Deron saw a problem. The trading education industry was filled with hype, unrealistic promises, and "gurus" who couldn't actually trade.
He knew there had to be a better way. So, he launched Morpheus Trading Group with a simple mission: bring institutional-grade trading education to individual investors who were serious about learning.
No hype. No get-rich-quick promises. Just real methodology, real psychology, and real results — tracked and published for everyone to see.
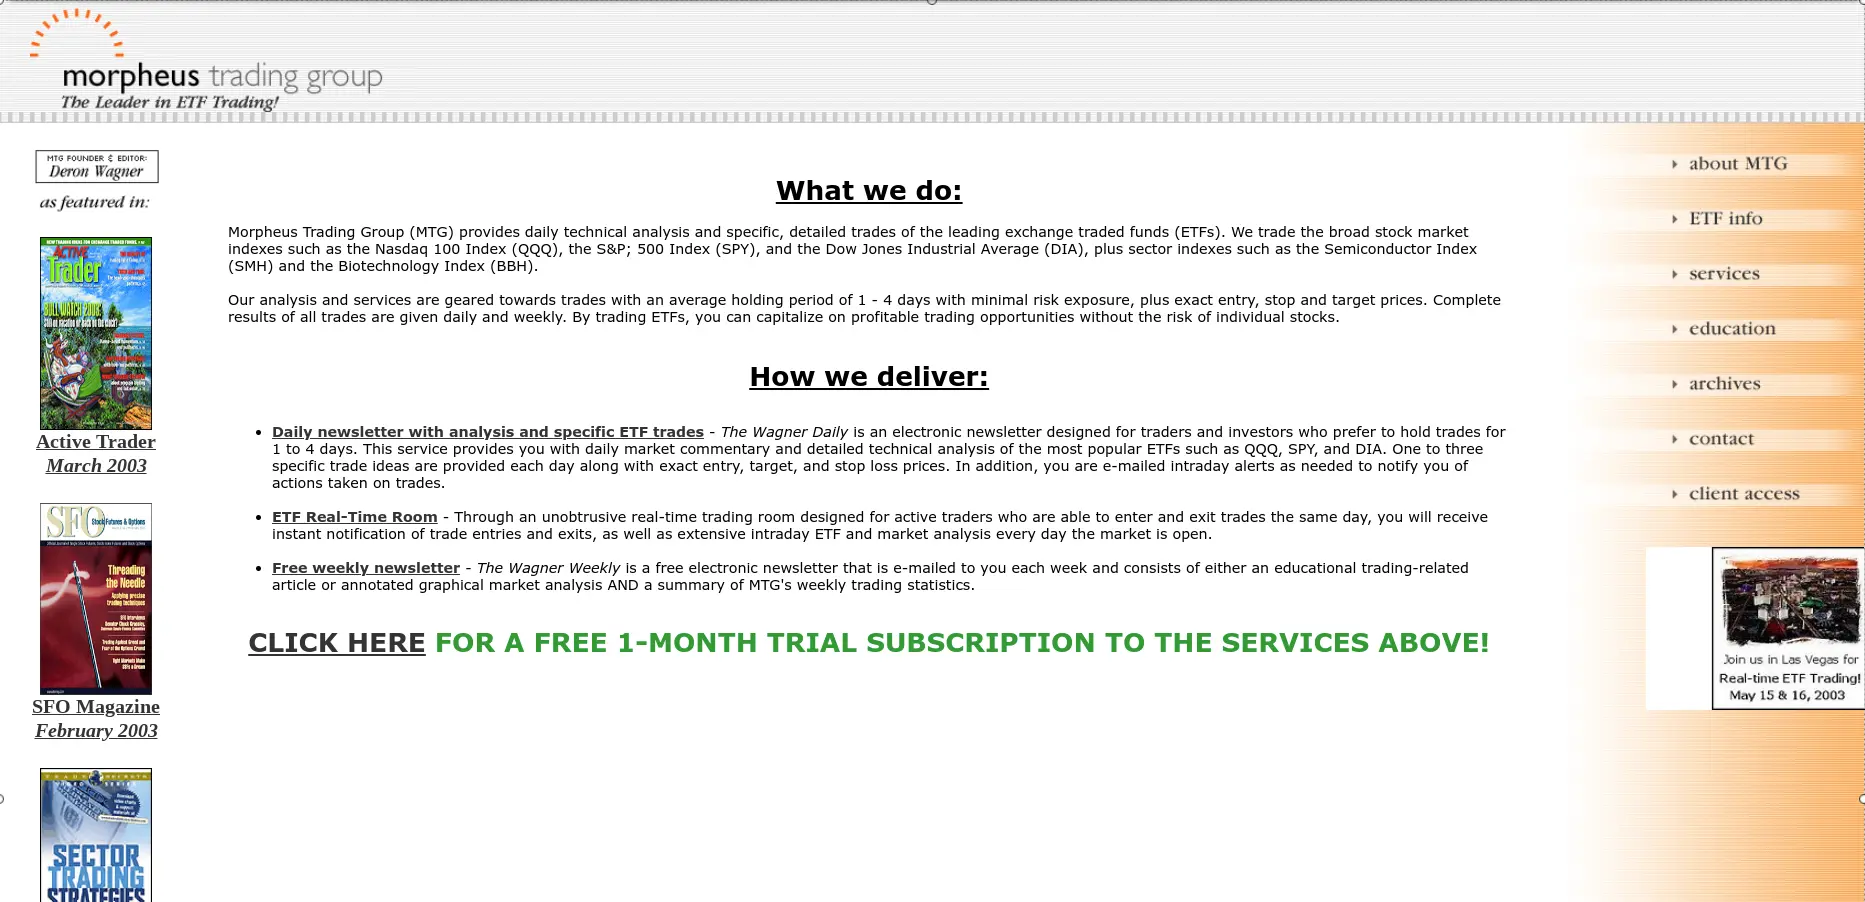
Our original website from 2003 — humble beginnings!
23 Years of Milestones
A track record through bull markets, bear markets, crashes, and recoveries
MTG Founded
Morpheus Trading Group launches alongside The Wagner Daily newsletter. One of the first active trader education sites on the web.
Building the Foundation
Published first trading books. Became a featured speaker at MoneyShow conferences. Community grows to thousands of active traders.
Financial Crisis — Methodology Proven
While others panicked, our market timing model signaled to go to cash and selectively short. Members protected capital when it mattered most.
Gold Medal Award
Trading ETFs: Gaining an Edge with Technical Analysis wins Gold Medal at the Axiom Business Book Awards — becoming essential reading for institutional and retail traders alike.
Global Expansion
Featured speaker at MoneyShow Shanghai. Regular CNBC, ABC, and Yahoo Finance appearances. Contributor to Investor's Business Daily, Barron's, and Active Trader magazine.
Pandemic Volatility — Another Test Passed
COVID market crash tests methodology again. The strategy performs, validating 18 years of development through another black swan event.
Historic IEAC Accreditation
Morpheus Trading Group becomes the first trading education company in the world to achieve IEAC accreditation — meeting university-level academic standards.
TradeQuest & Global Expansion
Launch of TradeQuest certification program with proprietary Digital Graphic Novel format. Expanding across the United States and Southeast Asia.
The Philosophy That Drives Us
What separates consistently profitable traders from the rest...
"Trade What You SEE,— Deron Wagner's Core Trading Philosophy
Not What You Think"
Psychology First
Technical indicators are just tools. The real edge comes from mastering the emotional and behavioral mistakes that derail even experienced traders.
Risk Management
Never risk more than 0.5% to 1.5% of total portfolio per trade. Small, consistent gains compound into significant wealth. Swinging for the fences leads to blown accounts.
End-of-Day Trading
No staring at screens all day. Our swing trading methodology is designed for busy professionals who want results without sacrificing their lives.
The MTG Swing Trading Strategy
A simple, proven strategy for swing trading stocks, ETFs, crypto, and more —
refined over 23+ years
📈 What We Look For:
- ✓ Price Action — Relative strength vs. the market
- ✓ Volume — Accumulation and distribution patterns
- ✓ Moving Averages — Key support/resistance levels
- ✓ Chart Patterns — Breakouts, Pullbacks, Trend Reversals
- ✓ Fundamentals — Strong earnings & revenue growth
🎯 How It Works:
Our strategy targets 20-40%+ moves in trending growth stocks and cryptocurrencies over several weeks to months.
We don't day trade, making this the perfect side hustle for busy professionals.
When markets turn bearish, our proprietary timing model signals when to move to cash — protecting gains while others panic.
The result: 23 years of published results through bulls, bears, crashes, and recoveries.
Published Works
5 trading books published by the world's leading financial publishers
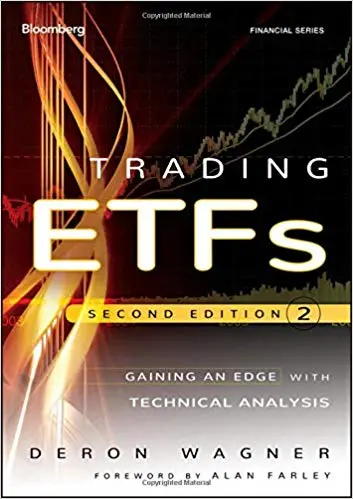
Trading ETFs
★ Gold Medal Winner
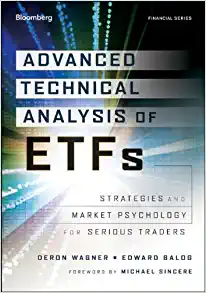
Advanced Technical Analysis of ETFs
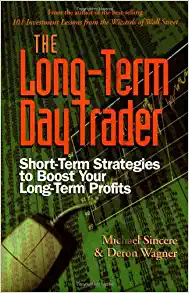
The Long-Term Day Trader
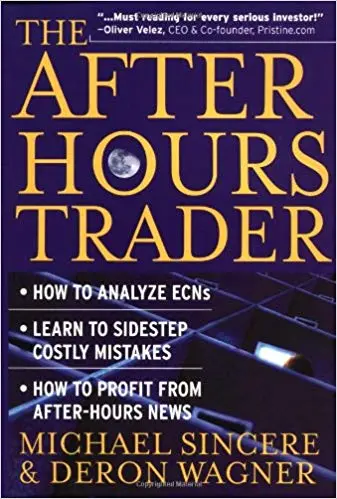
The After-Hours Trader
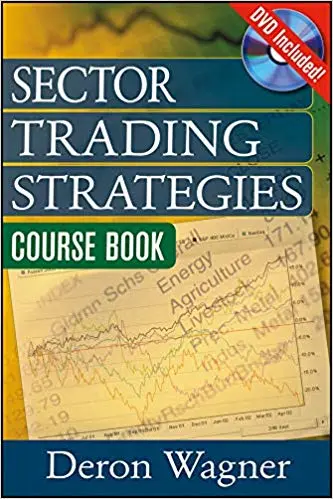
Sector Trading Strategies
A Historic Milestone
The first trading education company in the world to achieve IEAC accreditation


In October 2024, Morpheus Trading Group became the first trading education company in the world to achieve IEAC accreditation — meeting university-level academic standards.
The International Education Accreditation Council (IEAC) holds educational institutions to rigorous academic standards. Earning this accreditation validates what we've believed since 2002: trading education should be held to the same standards as any other professional discipline.
While other trading "gurus" make wild promises, we submitted our curriculum, methodology, and track record to independent academic review — and passed. This exclusive seal is earned through demonstrating educational excellence.
What this means for you:
- Learning from the world's only accredited trading educator
- Methodology validated by independent academic experts
- Curriculum meeting university-level educational standards
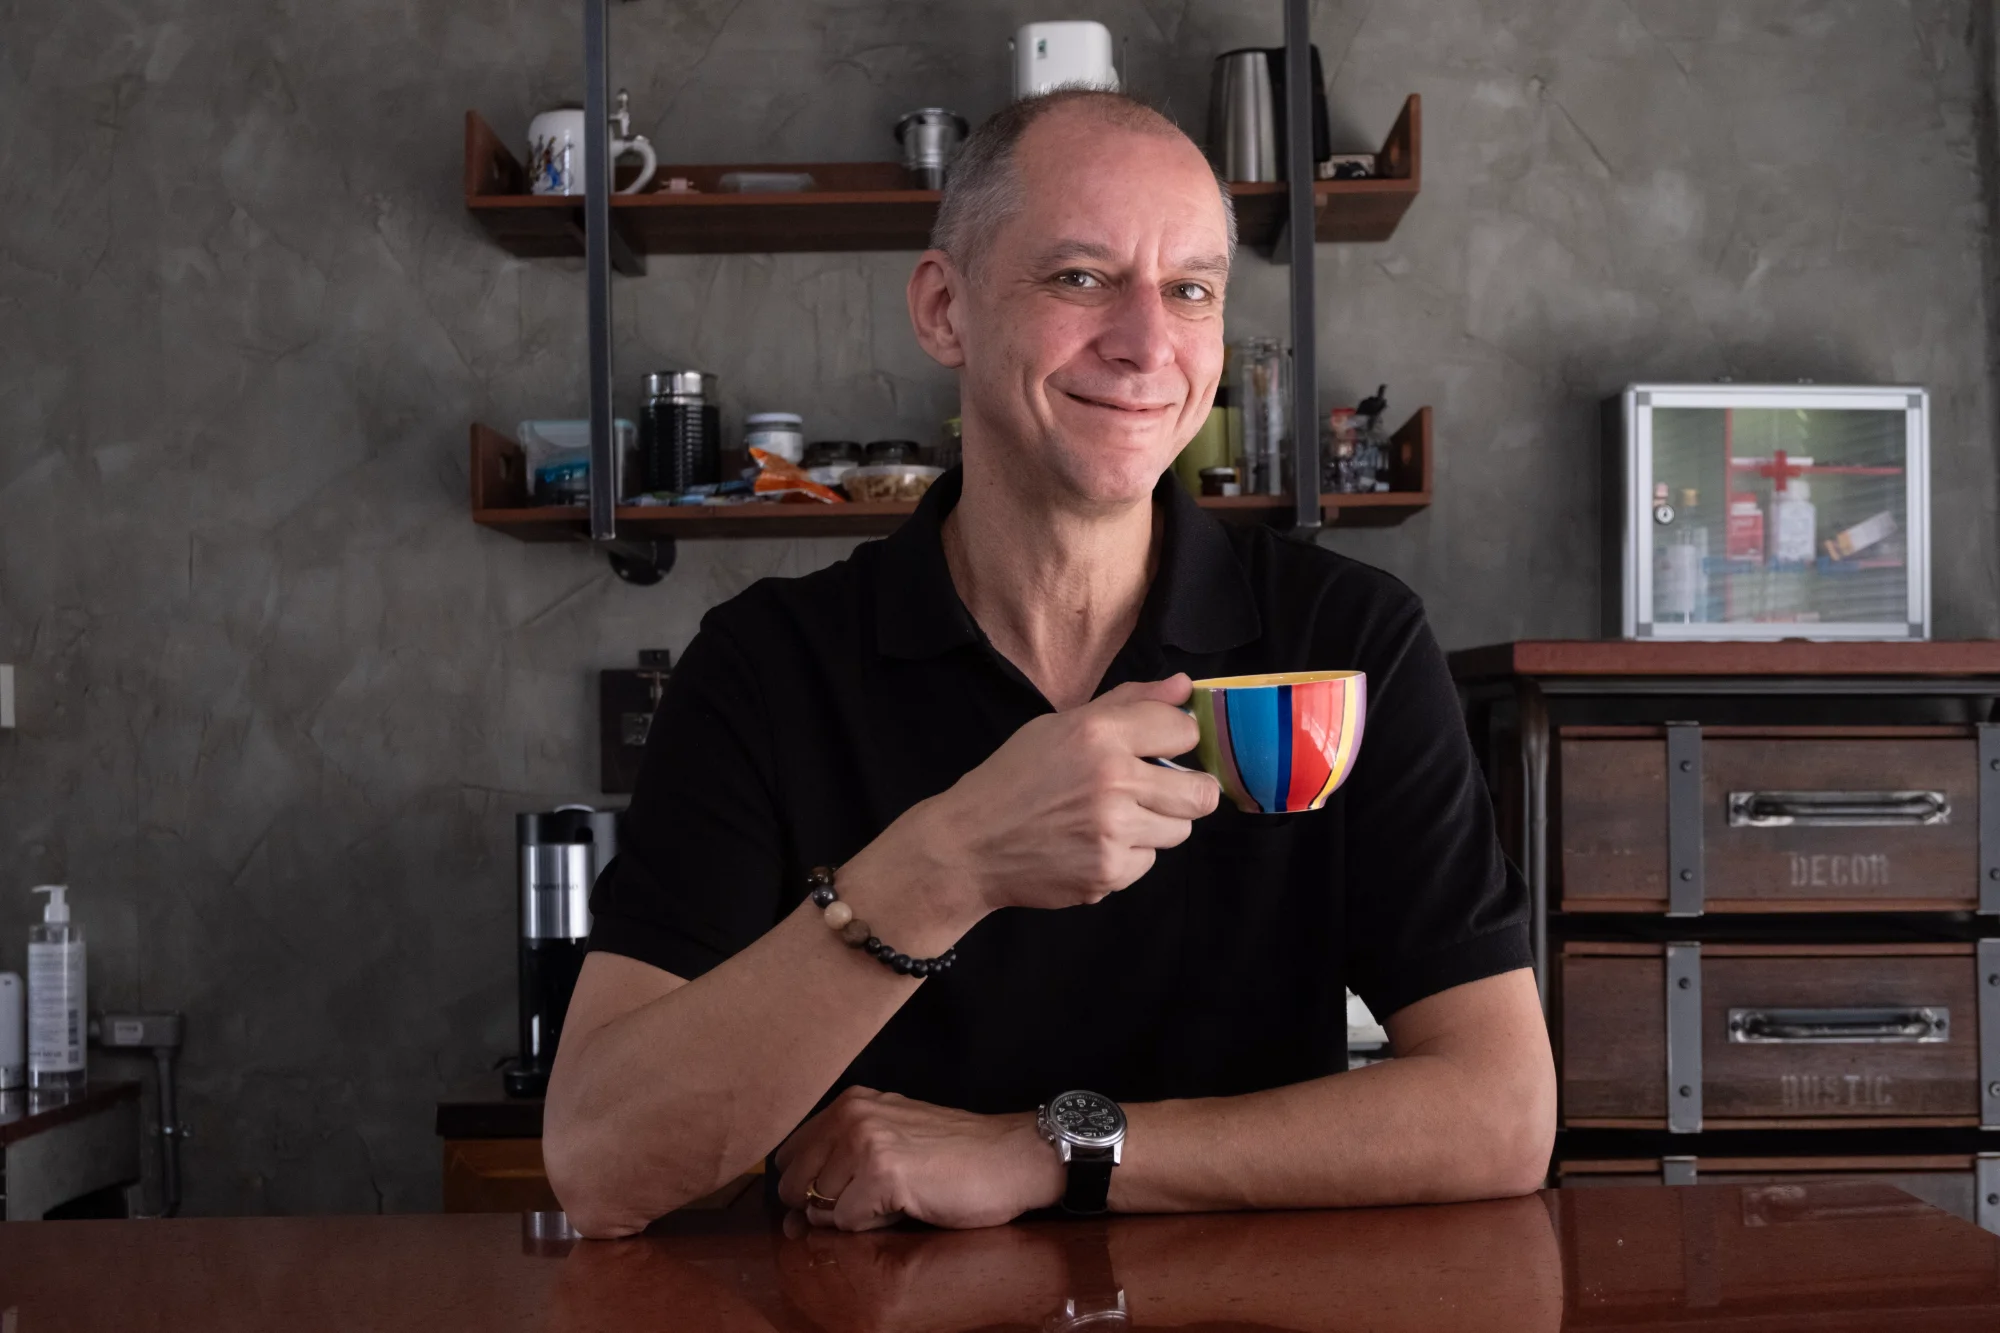
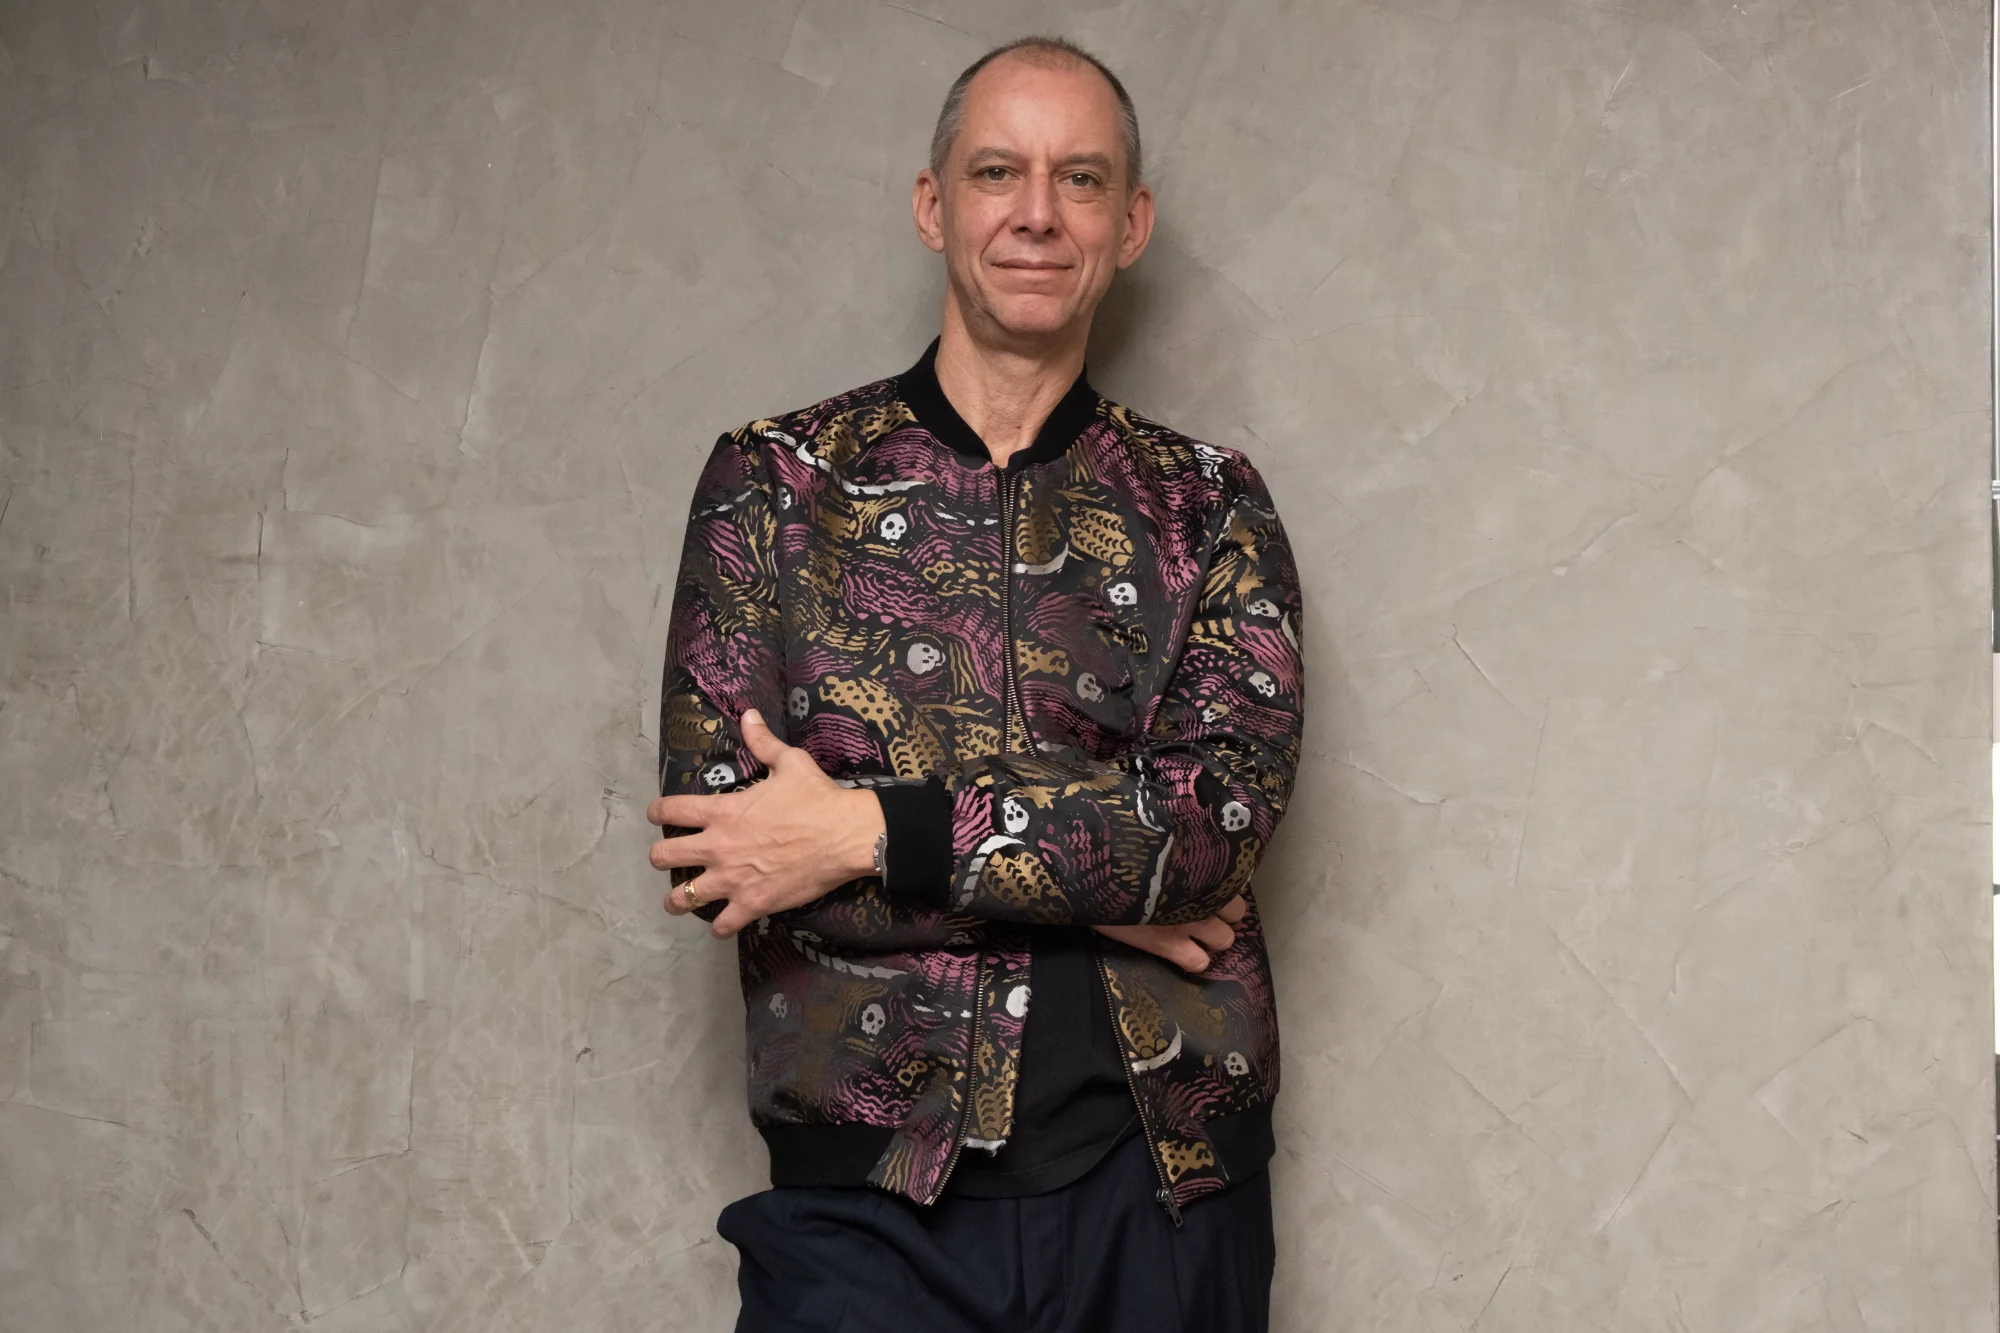
Deron Wagner, PhD (h.c.)
Founder and CEO @ Morpheus Trading Group
Deron Wagner is a professional trader, former hedge fund manager, and founder of Morpheus Trading Group (MTG), America's first and only IEAC-accredited trading education firm. With more than 25 years of experience in the financial markets, Wagner has built a reputation for combining institutional trading methodology with accessible education for serious investors.
Wagner began his career as a proprietary trader at major U.S. trading firms, where he not only traded firm capital but also trained other professional traders in systematic technical analysis, psychology, and risk management. This institutional foundation led him to establish Morpheus Capital LP, a long/short equity hedge fund, while simultaneously launching Morpheus Trading Group in 2002 to share his methodology with individual investors.
As an author, Wagner has written five books on trading and technical analysis published by Bloomberg Press, Wiley, and McGraw-Hill. His most recognized work, Trading ETFs: Gaining an Edge with Technical Analysis (Bloomberg Press), won a Gold Medal in the Investing Category at the 2009 Axiom Business Book Awards and has become essential reading for both institutional and retail traders.
Wagner's market insights have been featured on CNBC, ABC, and Yahoo! FinanceVision, and he has been a regular contributor to Investor's Business Daily, Barron's, and Active Trader magazine. For more than two decades, he has been a featured speaker at MoneyShow and TradersExpo conferences across the United States and internationally, including MoneyShow Shanghai.
What distinguishes Wagner from most trading educators is his emphasis on trading psychology over technical indicators. His core philosophy — "Trade What You See, Not What You Think" — addresses the emotional and behavioral mistakes that derail even experienced traders. This psychology-first approach has become central to his teaching methodology and speaking engagements.
Through Morpheus Trading Group, Wagner has educated over 5,000 paid students and published The Wagner Daily, his flagship swing trading newsletter, continuously since 2002 — a 23-year track record through multiple market cycles including the 2008 financial crisis, 2020 pandemic, and 2022 bear market.
Wagner continues to actively trade and manage private accounts while leading MTG's educational mission.
The MTG Tribe Today
Where we are now — and where we're headed...
TradeQuest — The Future of Trading Education
Wagner's latest innovation is TradeQuest, a comprehensive swing trading certification program built on a proprietary Digital Graphic Novel educational format designed to dramatically improve knowledge retention. After years of development waiting for technology to catch up with his vision, Wagner is now expanding MTG's reach across the United States and Southeast Asia, bringing institutional-grade trading education to a new generation of serious investors.
Ready to Join the MTG Tribe?
Whether you're just starting out or looking to refine your edge, we have a path for you.