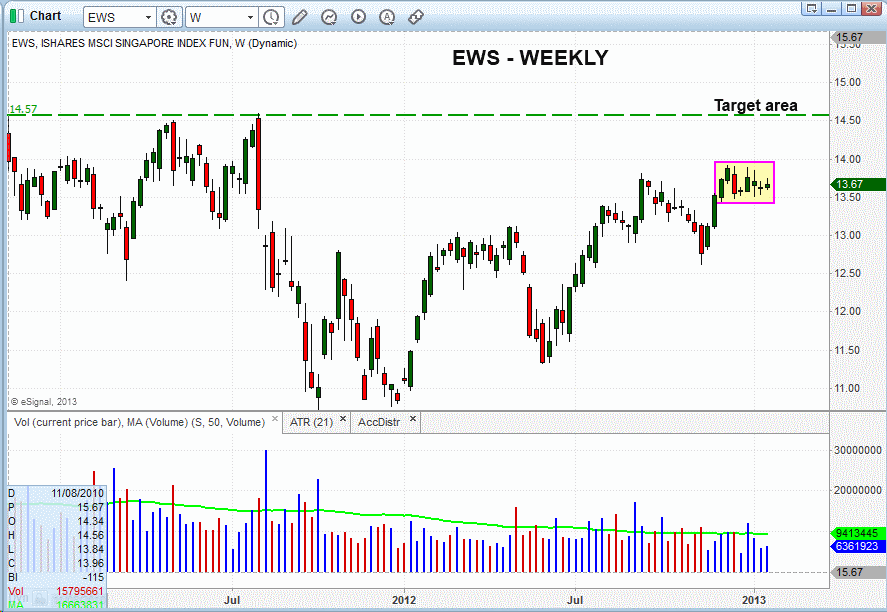
Going into this week, we have one new technical ETF swing trade setup on our watch list, which is another international ETF was a bullish chart pattern. The iShares MSCI Singapore Index Fund ($EWS) has been exhibiting tight, sideways price action over the past six weeks, near its prior highs and just above the $13.50 level. This is exhibited on the weekly chart below:

In the near-term, we anticipate this bullish price consolidation should spark a breakout that leads to a test of the prior highs from 2011. This should be a realistic near-term price target for swing traders, and is marked by the dashed horizontal green line on the chart above (around the $14.50 area).
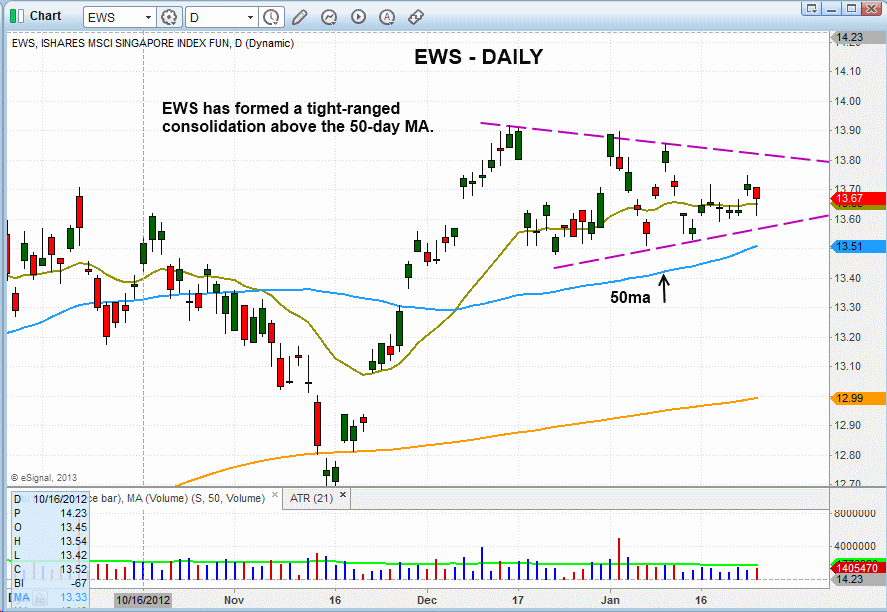
Dropping down to the shorter-term daily chart, the consolidation of the past six weeks is more apparent. Specifically, we see tightening price action between converging trendlines (basically a pennant chart pattern). Further, the three main moving averages we follow overall trending higher and in the right order. This means the 20-day exponential moving average is above the 50-day moving average, and the 50-day moving average is above the 200-day moving average. All these factors confirm a healthy price consolidation that favors the odds of an upside breakout.

Another key element that determines the health of a chart pattern is the volume trend. With $EWS, notice that volume has been tapering off over the past two weeks, and the 10-day moving average of volume is at its lowest level since March 2012. It is always positive when volume drops after several weeks of a bullish consolidation, especially when a pattern is close to completing and following through with the breakout. Lighter volume during consolidation is bullish because it indicates the bears are not selling into strength of the recent upward move; rather, the bulls are merely taking a rest.
Because this ETF meets our rules for a potential breakout entry, $EWS has been added to our “official” watchlist as a potential swing trade by entry in today’s Wagner Daily stock newsletter (sign up at at https://www.MorpheusTrading.com). Regular subscribers should note our predetermined and exact entry, stop, and target prices for this trade setup above.
In case you missed it, be sure to check out the new video recording from our Live Stock Analysis Webinar that was held on January 24. We have received a lot of positive feedback from it, and trust you will enjoy it too. Also, as a reminder to subscribers, please attend our “members only” webinars every Monday and Wednesday at 12 pm, which will help you get maximum value from our service. It is here where you will learn the most about our system of swing trading stocks and ETFs. For those who are unable to attend the live webinars, simply log in to the Members Area to access a video recording after 5:00 pm on the day of each webinar.
The above commentary is a shortened version of the January 28 issue of our exclusive Wagner Daily swing trade newsletter. To learn how to trade stocks and ETFs for consistent trading profits, while reducing your risk by following our stock market timing system that works, give our end-of-day stock newsletter a 30-day risk-free test drive by visiting this page.
