Over the past few weeks, a vast majority of stocks and ETFs have been selling off alongside of the broad market. Exceptions in the realm of ETFs have been mostly limited to select commodity ETFs, such as precious metals and oil/gas.
We remain long and bullish on ProShares Ultra Silver ETF ($AGQ), as well as US Oil Fund ($USO), which is breaking out of a long base. Although both ETFs have pulled back over the past several days (quite normal after breaking out), their weekly chart patterns still look good and we anticipate further gains in the near to intermediate-term.
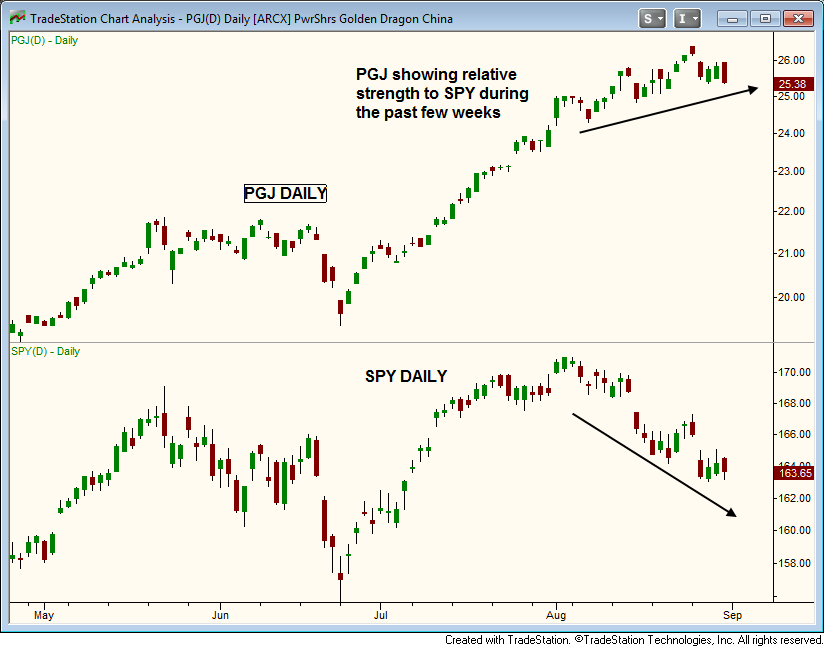
Another ETF that has been bucking the near-term bearish trend of the main stock market indexes recently is PowerShares China ETF ($PGJ), one of the few non-commodity ETFs that has been outperforming the benchmark S&P 500 Index over the past few weeks. Take a look:

On the daily chart above, the recent relative strength of $PGJ versus $SPY (S&P 500 SPDR ETF) is quite clear. Notice, for example, that $SPY failed its breakout attempt to new highs in August, but $PGJ held its breakout and pushed significantly higher.
When a stock or ETF is so strong that it continues to trend higher while the main stock market indexes are trending lower, it typically surges much higher as soon as the broad market bounces. This is the basis of relative strength trading, the main aspect of the ETF swing trading system detailed in my book, Trading ETFs: Gaining An Edge With Technical Analysis.
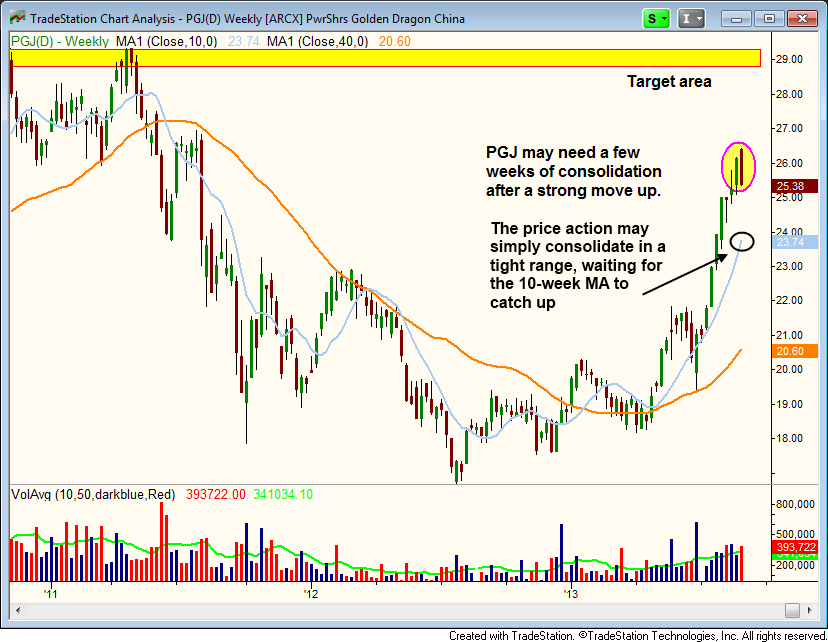
Now, let’s take a look at the longer-term weekly chart pattern of $PGJ below:

The weekly chart shows that $PGJ has been surging steadily higher for several months, and at a very steep angle of attack. However, after a strong 10-week advance from the touch of the 40-week moving average (orange line) in late June, $PGJ may now be due for a healthy 4-5 week correction.
Given its convincing bullish momentum, it’s probable that $PGJ will eventually rally at least to its prior highs of 2011 (about 15% higher), but the ETF is likely in need of a short rest before doing so.
Because the reward-risk ratio for this trade setup is not very positive at the moment, $PGJ is not yet an actionable trade setup. Nevertheless, put this ETF on your watchlist because it could soon be in play and present a profitable momentum trading opportunity.
As for a specific buy entry point, look for the 10-week moving average (same as the 50-day moving average) to catch up while $PGJ consolidates in a tight range. If that happens, a breakout above the high of that new base would be buyable, with a protective stop just below the low of the range.
As always, subscribing members of our nightly ETF and stock picking newsletter will be notified of our exact entry, stop, and target prices for this trade setup if/when $PGJ meets our criteria for buy entry.
If you enjoyed this post, please share with your favorite social network on the left. As always, your comments and feedback are appreciated as well.

One comment on “Why You Need To Put This China ETF On Your Trading Watchlist ($PGJ)”