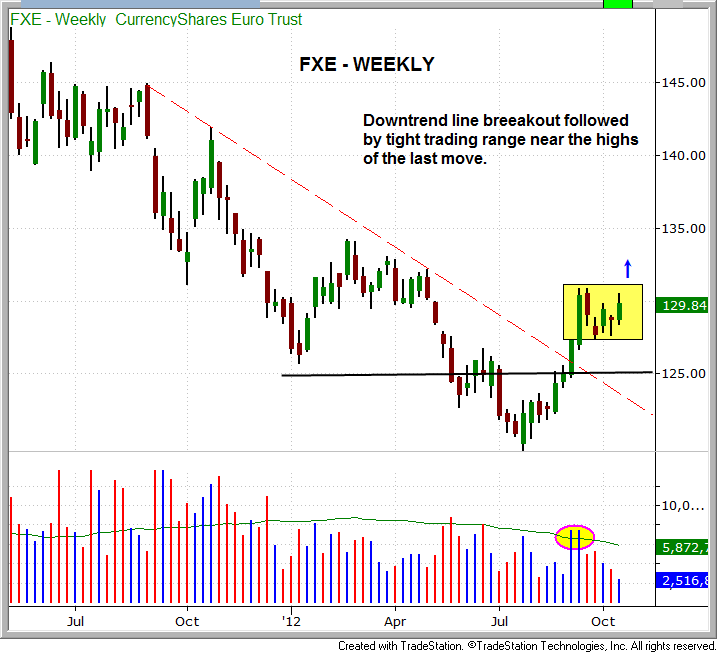
Earlier this week, in our ETF and stock swing trading newsletter, we posted a chart of CurrencyShares Euro Trust ($FXE) that showed a bullish consolidation above long-term support of the 200-day moving average. As a follow-up to that analysis, the longer-term weekly chart below shows the breakout above a year-long downtrend line, along with a coinciding pickup in volume:

With the strong move off the July 2012 low, the price action of FXE should continue to consolidate in a tight range, and ideally not retrace more than 38% of the rally from the July 27 low to September 14 high. Currently, the low of the present consolidation is only 33% off the high of the move.
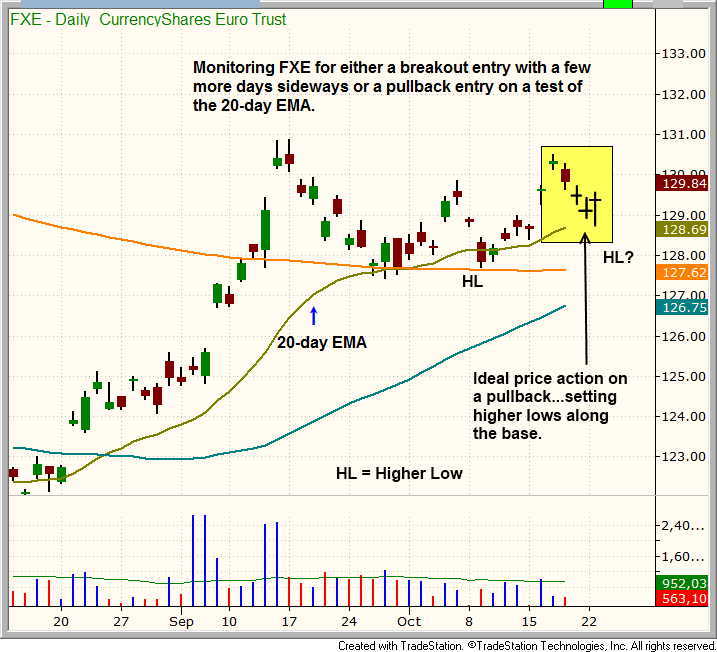
We are now monitoring $FXE for a potential low-risk buy entry point on a pullback, especially if the price action can test the rising 20-day exponential moving average, along with forming a “higher low.” However, the price action does not have to pull back. Rather, there could be a correction by time, in which the price could just drift sideways for a day or two before breaking out above the October 17 high. This is explained in more detail on the daily chart of FXE below:

Since FXE is a currency ETF, one bonus is that it has a low correlation to the direction of the overall stock market. With our market timing system now in “sell” mode, we focus more on ETFs that are not comprised of industry sectors. If FXE meets our strict criteria for buy entry, subscribers of our newsletter will be notified in advance of our exact entry, stop, and target prices.
