 In case you’re too young to know, the title of this blog post is the tagline from the (crappy) sequel to the terrifying 1975 horror film, Jaws (which is definitely not crappy).
But it also reminds me very much of last week’s price action in the broad market. Here’s why…
After several days of encouraging price action, the NASDAQ Composite edged back above key resistance of its 20 and 50-day moving averages, while the benchmark S&P 500 simultaneously marginally rallied to a fresh all-time high.
By the middle of last week, it was starting to look as though the losses from the March pullback could be quickly be erased by a solid start to the second quarter of 2014.
But by Friday, stocks did a superb job of reminding traders and investors how swiftly and substantially the technical outlook of a market can change in just one day!
NASDAQ ($QQQ) – On Its Way To The 200-Day MA
After plunging 2.6% lower, the NASDAQ sliced through pivotal support of its 50-day moving average for the second time in two weeks. Furthermore, the index also finished below horizontal price support of its prior “swing low” from March 27.
The large-cap NASDAQ 100 also cracked below its 50-day moving average, and now appears to be headed for long-term support of its 200-day moving average (or 40-week MA). Below, this is shown on the weekly chart of PowerShares QQQ Trust ($QQQ), a popular ETF proxy for the NASDAQ 100 Index:

Based on its current rate of ascent, the 40-week/200-day moving average may end up converging with the the February 5 swing low, which is the most recent major area of horizontal price support (around $83-$84).
Over the next several weeks, odds are now pretty good that both the NASDAQ Composite and NASDAQ 100 will decline to their 40-week/200-day moving averages before the current bearish sentiment of the broad market eases up.
S&P 500 ($SPY) – False Breakout Could Spell Big Trouble
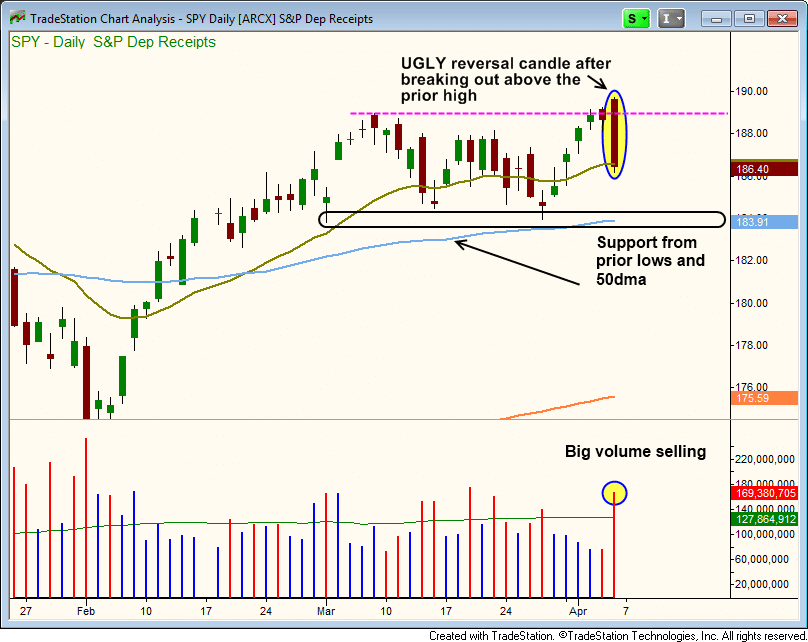
The S&P 500 has held up quite well against the relative weakness of the NASDAQ, but last Friday’s sell-off created an ugly, wide-ranged reversal candlestick on heavy volume.
Worse is that the April 2 move to a new all-time high has now turned into a false breakout.
Whenever a stock or index rallies to a new high, but quickly gets slammed on higher volume a day or two later, the bulls who bought the breakout become trapped and are forced to abruptly cut their losses and bail out.
This, in turn, attracts more selling interest that causes momentum of the sell-off to build on itself.
The false breakout of the S&P 500 can easily be seen on the daily chart of the S&P 500 SPDR ($SPY) below:

Although $SPY is still less than 1.5% below its record high, near-term bearish momentum sparked from last Friday’s tumble will probably cause $SPY to fall to convergence of its 50-day moving average and prior swing lows around $184 (highlighted on the chart above) before seeing a significant bounce.
Even if $SPY/S&P 500 is able to hold support of the 50-day moving average, the index will still have a tough time getting back above last Friday’s (April 4) high anytime soon.
Perhaps the best-case scenario is simply for the S&P 500 to hold at convergence of its recent low and 50-day moving average, which may actually be a tall order if the NASDAQ continues to sell off and weigh the broad market down.
The Industry Sectors To Watch
Over the next one to two weeks, we will be closely monitoring major industry sectors to provide us with more evidence regarding the strength (or not) of the S&P 500.
The recent resurgence in energy-related stocks has been helping the S&P outperform the NASDAQ lately, but if financial and transportation stocks begin breaking below their 50-day moving averages, the S&P 500 may soon fall apart and join the NASDAQ. ETF proxies to monitor these sectors include: $XLE – Energy, $XLF – Financials, $IYT – Transportation.
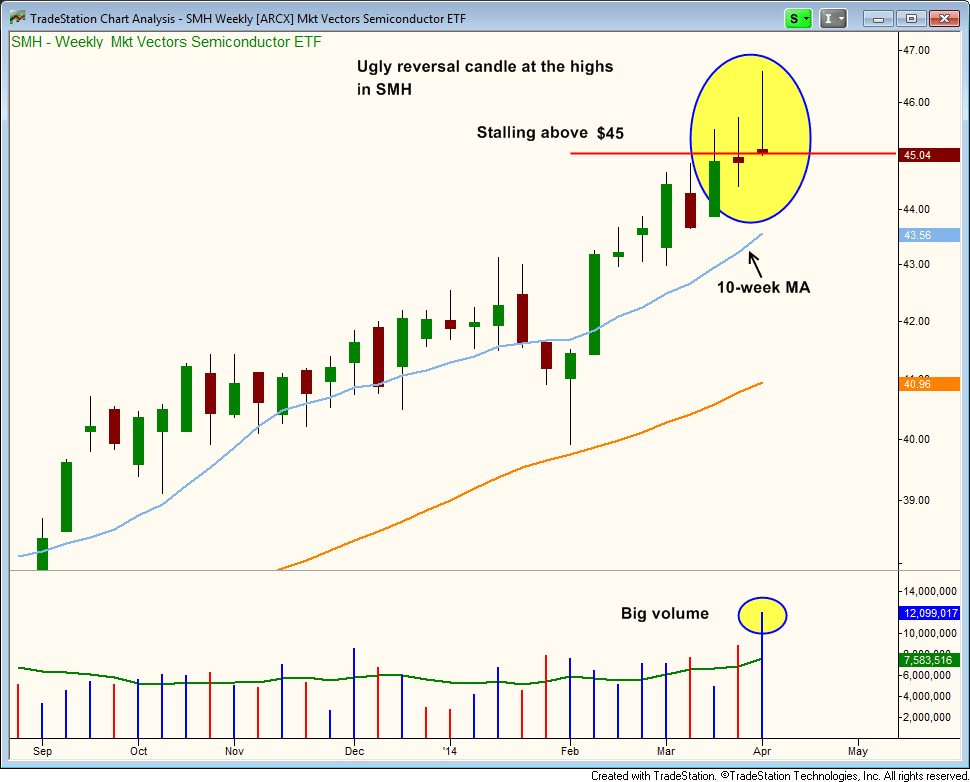
Market Vectors Semiconductor ETF ($SMH) has been showing impressive relative strength, despite major weakness in the Nasdaq. But after three weeks of stalling action at the $45 area, we now expect a pullback to the rising 10-week moving average (at the very least).
As shown on the weekly chart below, $SMH closed last week with an unsightly reversal candlestick on heavy volume, right at the highs:

Commodity ETFs – The Best Refuge For Bulls?
Commodity-related ETFs continue holding up well and may be one of the few pockets of strength, even if the stock market continues to correct lower.
Some of the bullish-looking ETFs we are currently long, or are monitoring for potential buy entry, include: Corn ($CORN), Coffee ($JO), Agriculture ($DBA), Uranium ($URA), and Natural Gas ($UNG).
In case you missed it, be sure to check out our April 1 analysis of the Corn ETF ($CORN), which broke out above a 4-week trading range and gained 3.8% last week.
Also, you may want to review how we gained 19% in just 6 days with $JO, as the ETF may again be setting up for potential buy entry on its current pullback (subscribers of The Wagner Daily newsletter will be notified of our exact buy trigger, stop, and target prices if/when we re-enter $JO).
When Defense Is The Best Offense
Without a doubt, broad market price action over the past two weeks has been quite volatile, divergent, and indecisive.
While the current, high-volatility environment may be ideal for intraday traders, it has admittedly been a challenging period for short to intermediate-term swing traders.
Although we have not exactly been raking in the profits over the past two weeks, our market timing system has fortunately kept us out of trouble and enabled us to preserve most of the big gains we locked in February and early March.
When both the NASDAQ Composite and leadership stocks are convincingly breaking down below their 50-day moving averages, it’s a clear signal to stay away from the long side of the stock market (for our rule-based system at least).
Last Friday’s nasty nosedive forced our timing model back into “sell” mode after improving back to “neutral” mode for just two days (click here to learn what each mode means).
The NASDAQ is now in a heap of trouble, and its next stop will most likely be the 200-day moving average. With many leadership stocks now under heavy distribution (institutional selling), there is simply no reason to initiate new stock trades on the long side until overall market conditions settle down.
Nevertheless, we must be patient on the short side and wait for low-risk short selling setups to develop.
If you’re new to our momentum swing trading system, it’s important to know we prefer short selling stocks on a bounce into resistance, rather than a breakdown below an obvious support level. Review our technique for short selling former leader stocks to learn more.
To receive exact trade details of any new short selling entries into former leadership stocks, as well as hot commodity ETF trade setups, subscribe now to our nightly swing trading newsletter.
