Led by solid gains in the Nasdaq 100 and Nasdaq Composite, stocks closed higher across the board yesterday (April 22). The Nasdaq Composite easily outperformed the S&P 500 on Monday, signaling that money is beginning to rotate out of the S&P 500 (and Dow) and into the Nasdaq. This is a positive sign for the bulls, but there is one main concern about this — a lack of higher volume.
Over the past two sessions, the Nasdaq has climbed about 2.5% off last Thursday’s low. However, volume declined in each of those past two sessions, which means the move was unconfirmed by institutional buying. The Nasdaq may need a bit more time to consolidate, as there is quite a bit of overhead resistance.
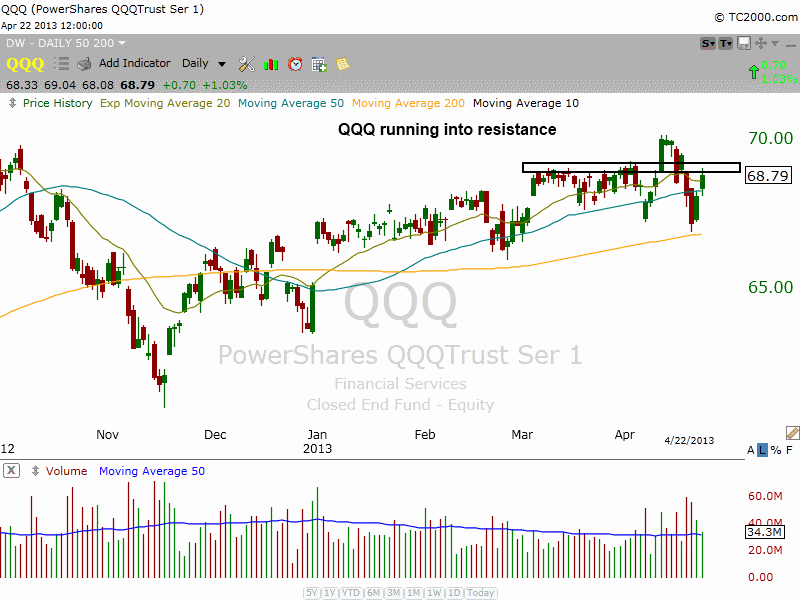
Looking at the daily chart of the Nasdaq 100 ETF ($QQQ) below, we see price action running into resistance clustered around the $69 level:

The five weeks of stalling action near $69, along with the 10 and 20-day moving averages, make for quite a bit of resistance. However, if $QQQ can power through this level without further consolidation, it would be a very bullish sign.
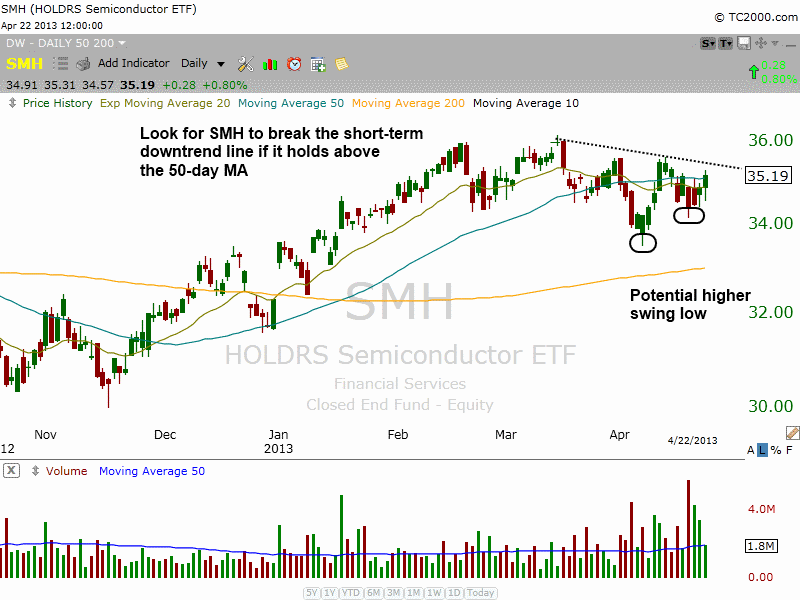
Market Vectors Semiconductor ETF ($SMH), an ETF we have been bullish on since the initial March 28 analysis on our trading blog, continues to chop around near the pivotal, intermediate-term indicator of its 50-day moving average, with support coming in around $34.50 last week.
If $SMH can set a higher swing low and close above Monday’s high on a pick up in volume, then it may attract enough buying interest to break the short-term downtrend line and test the highs of the base:

In today’s Wagner Daily newsletter, we are stalking $SMH for potential swing trade buy entry if it meets our technical criteria (looking to add to our existing position on strength). Subscribing members should note the details for $SMH in the “watchlist” section of today’s report. Presently, all five of the open positions in our model trading portfolio (3 ETFs and 2 individual stocks) are showing unrealized gains.
