We have mentioned several times recently that the NASDAQ has been the lone holdout in the broad market, in terms of it being the only index holding above its 50-day moving average.
Even with yesterday’s (August 27) sharp losses, the index is still above this important level of support (but now within 1% of it).
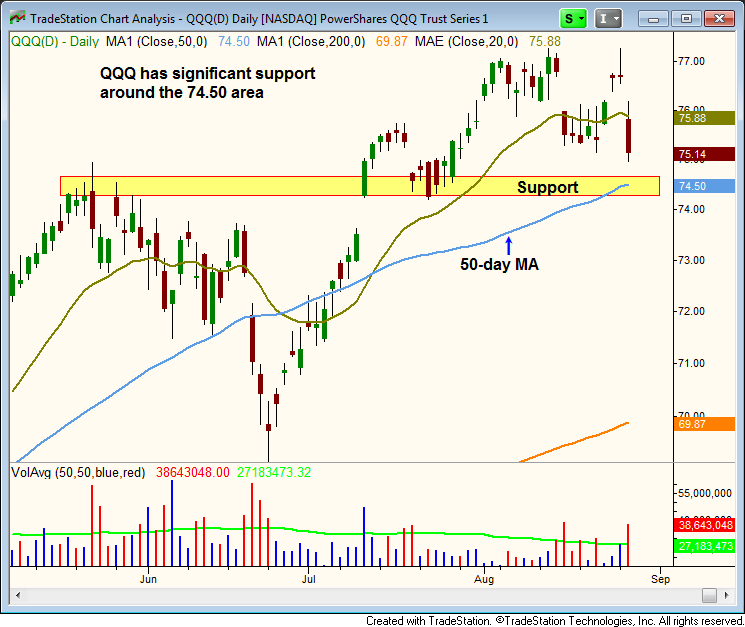
This is shown below on the daily chart of PowerShares QQQ Trust ($QQQ), a popular ETF proxy for the Nasdaq 100 Index (which has a similar chart pattern to the NASDAQ Composite):

Despite yesterday’s swift drop that caused $QQQ to break support of its prior swing lows from last week, notice the index is now less than 1% above a major level of horizontal price support that was formed by the prior highs of May, the lows of mid-July, and the 50-day moving average.
This triple convergence of price support could be significant enough to spark a bounce in the Nasdaq in the coming days, so keep a close eye on this level.
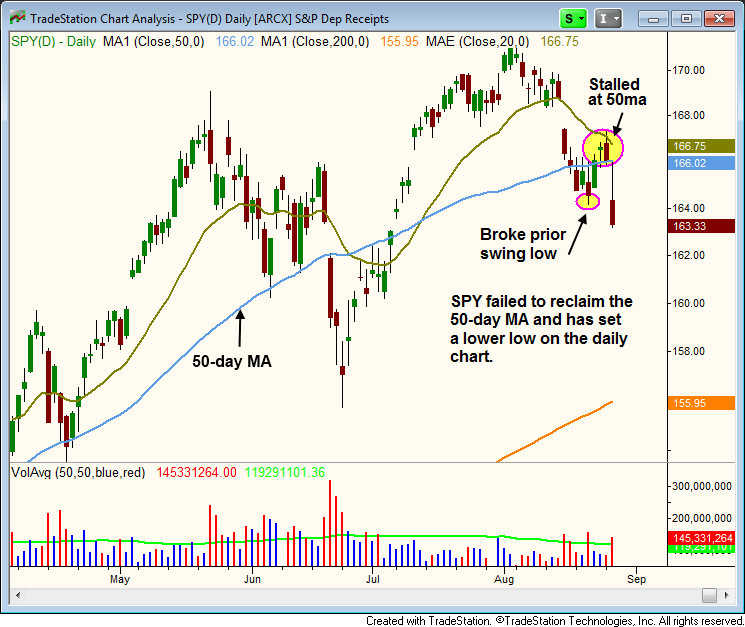
Conversely, the S&P 500 is now trading firmly below its 50-day moving average. As you can see on the chart of S&P 500 SPDR ($SPY) below, the benchmark S&P 500 is technically in much worse shape than the NASDAQ:

Before yesterday’s decline, $SPY had managed to reclaim support of its 50-day moving average. However, the index only managed to hold above that pivotal level for two days before falling back down (in a big way). The Dow Jones is in even worse shape because the index is already testing crucial support of its June 2013 lows. By comparison, notice how far above their respective June lows both the NASDAQ and S&P 500 remain.
For now, our market timing system (details here) remains in “neutral” mode. The only reason it has NOT yet shifted to “sell” mode is because the NASDAQ continues to hold above key, intermediate-term support of its 50-day moving average.
Nevertheless, if the NASDAQ joins the S&P 500 and Dow Jones Industrial Average in breaking down below its 50-day moving average as well, there would no longer be any reason to be on the long side of the market (with the exception of ETFs with low correlation to stock market direction).
Because we are trend traders, a shift to “sell” mode would also enable us to start selling short (stocks with relative weakness) and/or maintain a heavy cash position. All bets for individual stocks on the long side of the market would also be off.
To be instantly notified of changes to our market timing bias, as well as to receive the best nightly stock and ETF picks, click here now for your 30-day risk-free subscription to The Wagner Daily newsletter.
