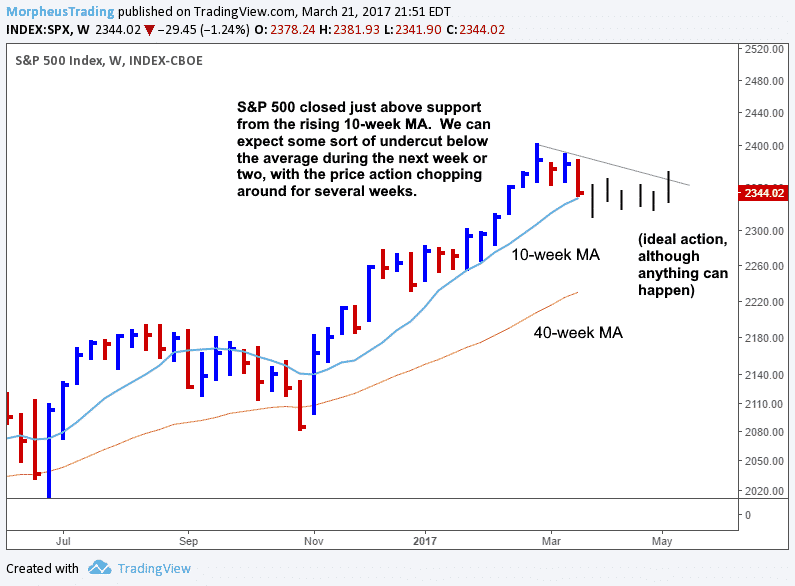
After three weeks of choppy, indecisive price action, the S&P 500 Index ($SPX) broke down below its range with a 1.2% plunge on Tuesday, March 21.
But while the bears may have suddenly put a damper on overall market sentiment, the good news is that $SPX is now sitting near an important area of support.
Specifically, the selloff caused the benchmark S&P 500 to close just above key support of its 10-week (and 50-day) moving average.
Considering the index also closed near its session low, the S&P 500 will likely undercut its 50-day moving average within the next few days.
If/when it does, be on the lookout for a fresh base of bullish consolidation to start developing as the price of $SPX corrects by time.
The ideal, hypothetical price action of $SPX is drawn on the weekly chart below, but this is obviously just one scenario and anything can happen:

Like the S&P 500, the near-term balance of power in the NASDAQ 100 and NASDAQ Composite has also shifted to the bears.
The charts similarly suggest both NASDAQ indices will likely need at least 4 to 5 weeks of sideways basing action before heading higher.
Proactively Manage Your Positions
Given current market conditions, it may be wise to sit on the sidelines to “wait and see” before entering new long positions.
However, there’s no reason to start panic selling every stock in your account either.
Rather, you simply need a clear plan of action to proactively manage your open positions.
Here is ours…
We are still giving “breathing room” to Wagner Daily stock positions that showed relative strength during the March 21 selloff.
On the other hand, we have already tightened stops on stock positions that have cracked support of their 20-day exponential moving averages.
If you have any big winners you’re still sitting on, consider locking in profits on partial share size, while keeping a loose stop on the rest.
For example, we will sell half the shares of Applied Optoelectronics ($AAOI) on today’s open to lock in a gain of approximately 60%.
We plan to continue holding the remaining half of the position through any consolidation, as long as the price holds above the 50-day moving average.
