After four straight weeks of gains, the Nasdaq and S&P 500 are now testing key resistance levels. Here’s a simple, inside look at how to successfully navigate a potential stock market pullback now.
Exactly one month ago, we wrote a blog post alerting you to a new, stealth buy signal in the Nasdaq.
Our timely alert was quite accurate, as the Nasdaq scored four straight weeks of gains and rallied +13% since then.
However, stocks may now be poised for a substantial pullback as the the Nasdaq and S&P 500 approach major resistance levels.
In this article, we walk through a few simple charts to show you why stocks may soon enter pullback mode.
More importantly, we highlight key support levels for the Nasdaq and S&P 500 that could present low-risk entry points for new swing trade entries.
Grab a pen or your trading platform to note the key support/resistance levels and let’s dive in!
Here’s what you will discover…
Today, we share analysis on both the daily and weekly charts of the following:
- S&P 500 Index ETF ($SPY)
- Nasdaq 100 Index ETF ($QQQ)
- Apple, Inc. ($AAPL)
$SPY is a broad-based benchmark ETF for measuring overall stock market performance.
$QQQ is a growth-focused ETF composed of the largest non-financial companies listed on the Nasdaq.
$AAPL is the highest weighted stock in both the Nasdaq 100 and S&P 500.
As such, monitoring the price action of $AAPL could offer potential clues that may influence the major indices.
For each of the above, we will first analyze resistance levels on the longer-term weekly charts.
Then, we will zoom in to the daily charts to determine shorter-term support levels on a pullback.
As always, we keep our analysis simple by focusing on trendlines, prior lows/highs, and Fibonacci retracements.
NOTE: Press any chart below to enlarge and open in a new window.
S&P 500 Index ETF ($SPY)
Weekly chart
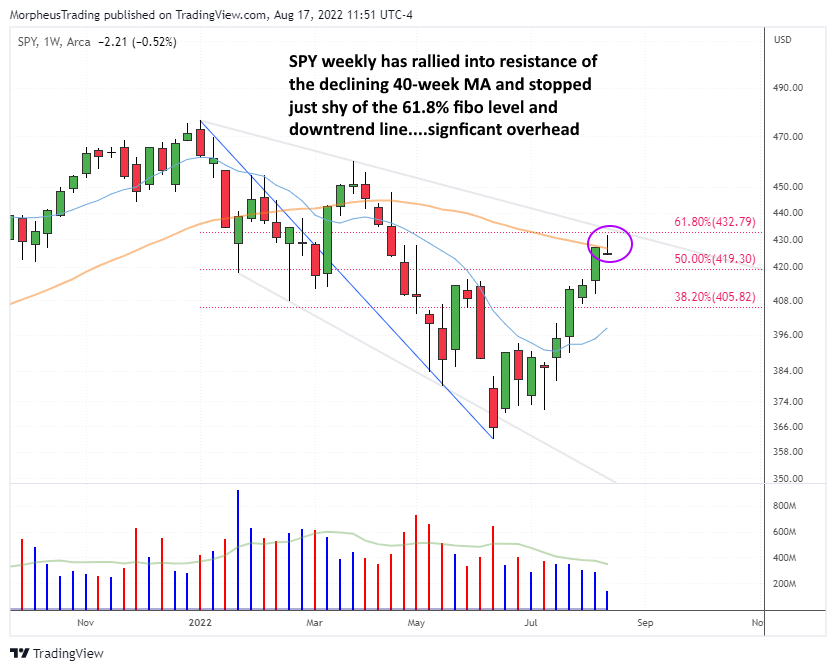
The peak of the prior bull market was set in the first week of January 2022.
From that level, a primary downtrend line has formed that connects with the March 2022 high.
Now, $SPY is forming a weekly shooting star candlestick pattern as it nears resistance of that downtrend line.
Resistance of the 61.8% Fibonacci retracement (from January high to June low) perfectly converges with the downtrend line.
Resistance of the 40-week moving average is also in the same area.
Triple convergence of the downtrend line, 40-week MA, and 61.8% Fibonacci retracement is major overhead resistance that will likely spark a significant pullback on the initial test.
Daily chart
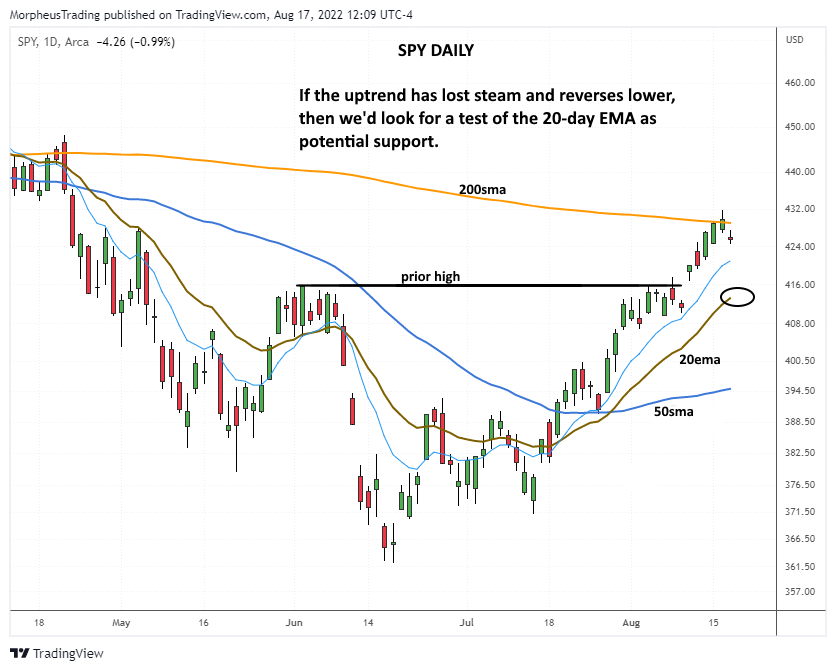
Zooming into the daily time frame, we see that $SPY reversed after running into its 200-day moving average—an important, indicator of long-term trend.
If the current pullback continues, then significant near-term support may be found at the rising 20-day exponential moving average (currently near $415).
The prior high from June may also provide initial support around the $418 level.
The $415 to $418 range is the logical target for short-term support in the coming days/weeks.
A basic law of technical analysis states that a prior level of resistance becomes the new support, after the resistance is broken (and vice versa).
Nasdaq 100 Index ETF ($QQQ)
Weekly chart
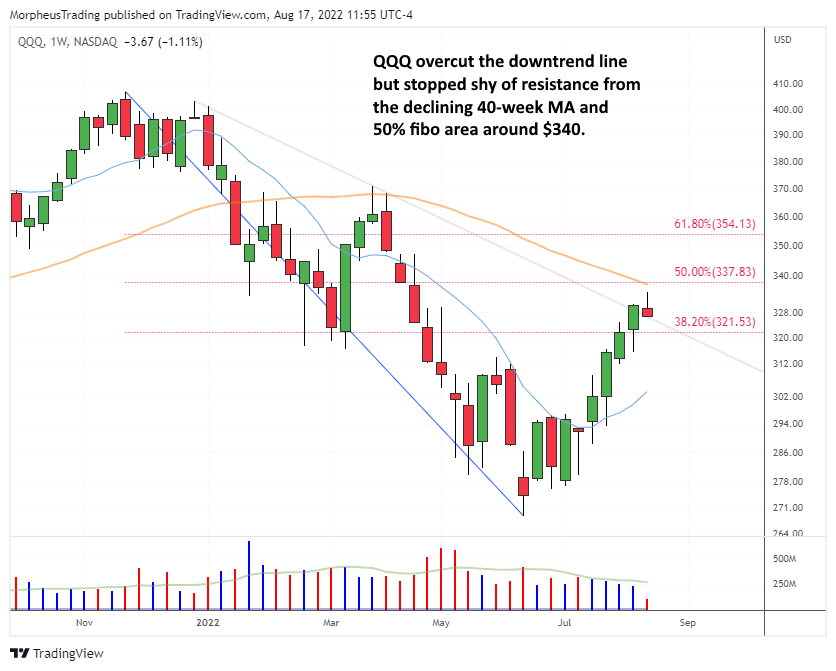
After four straight weeks of gains, $QQQ has overcut resistance of its weekly downtrend line.
In a bull market pullback, a one-week undercut of a key support level often snaps back above support the following week.
Likewise, a one-week overcut of resistance in a bear market can quickly fall back below the resistance.
Further, the rally stopped just shy of the 40-week moving average—which perfectly converges with the 50% Fibonacci retracement level.
Like $SPY, it appears $QQQ is also set up for at least a short-term pullback.
So, let’s look at where $QQQ may find support.
Daily chart
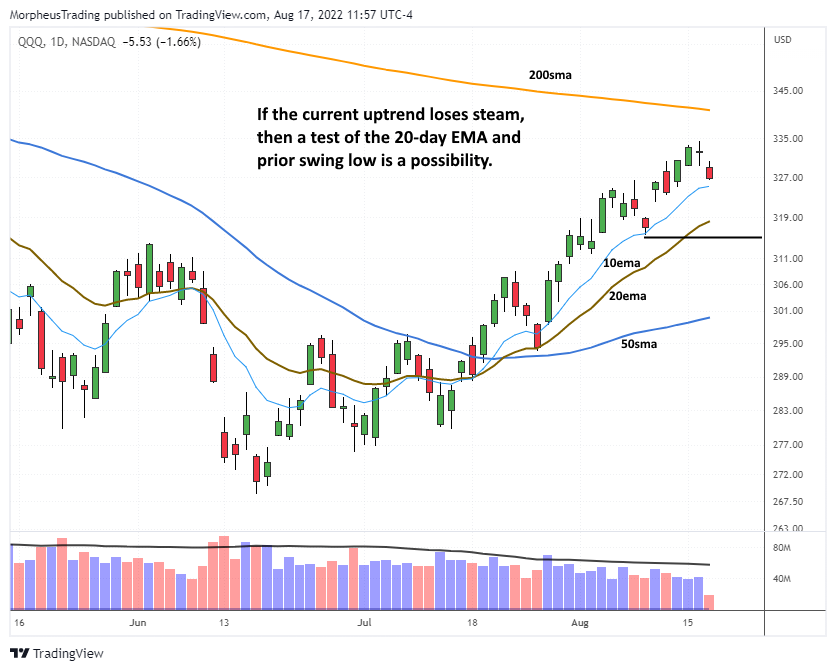
The rising 20-day EMA is currently just above the $319 level.
The August 9 low of $315.42 marks the prior swing low of the two-month uptrend.
A pullback to the $315 to $319 range is a likely area of short-term support if the current $QQQ pullback continues.
Apple, Inc. ($AAPL)
Weekly chart
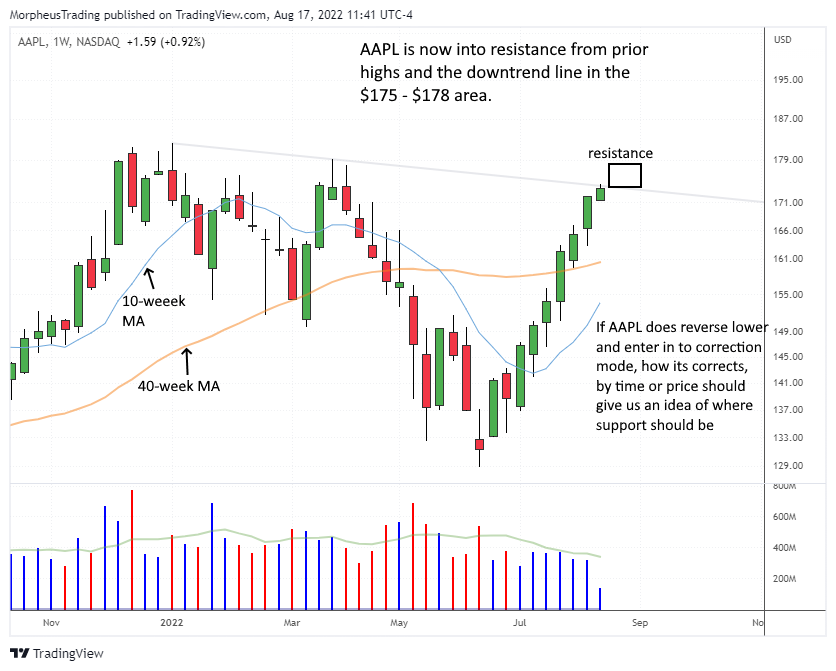
As mentioned earlier, it’s a good idea to track the price of $AAPL because it is the most heavily weighted stock in both $SPY and $QQQ.
If, for example, $AAPL starts showing relative strength to the S&P 500 and/or Nasdaq, it could be a positive sign of the overall market.
The opposite is also true if $AAPL starts lagging ahead of the major indices.
After six straight weeks of gains, we see that $AAPL is now coming into resistance of its downtrend line from the bull market high.
This gives investors a good excuse to take profits, which could lead to a pullback.
Daily chart
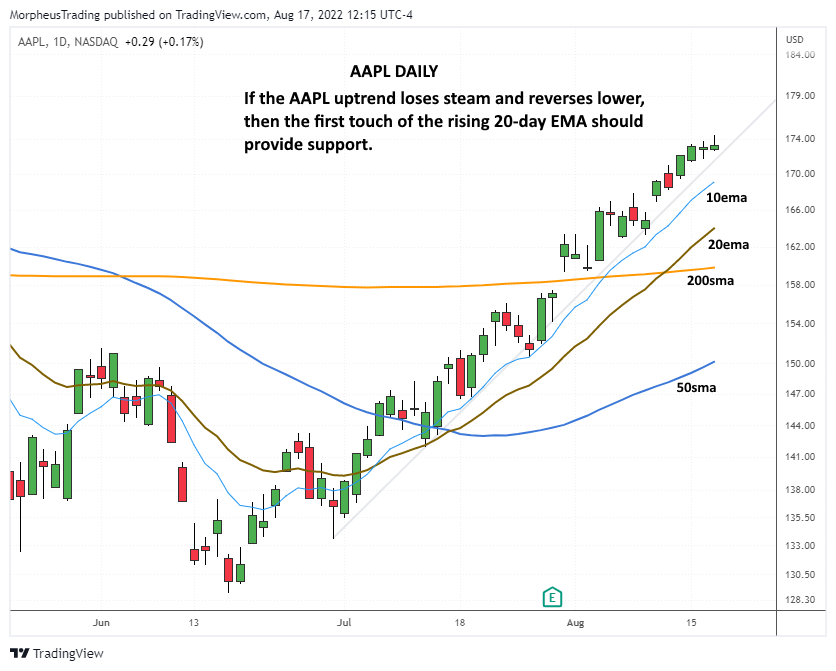
As with $SPY and $QQQ, look for the first touch of the 20-day EMA to provide initial support on a pullback (currently just above $165).
Unlike $SPY and $QQQ, $AAPL has already reclaimed long-term support of its 200-day MA—a bullish sign.
If the 20-day EMA fails to hold, more significant support of the 200-day MA may catch the price just below.
Be prepared for anything
If you’ve been trading or investing in stocks for a decent amount of time, you already know that anything is possible in the markets.
Successful traders have a plan for scenarios with high odds of occurring, BUT are always prepared for the unexpected.
The charts above show just one possible scenario that could occur as the broad averages approach major resistance—but it’s important to understand this is not a prediction.
Over the past twenty years, the Morpheus trading strategy has always focused on reacting to price action, not predicting it.
The Wagner Daily stock portfolio has a proven track record of scoring big gains in bull markets, and keeping members safe in bear markets.
What is the one of the biggest reasons for this?
We trade what we see, NOT what we think!
Start now with your exclusive Wagner Daily subscription to gain the inside edge to consistent stock trading profits and lifelong investing knowledge. Just press the button below for instant access.
“In trading, you have to go your own way…never be a follower! I tried many subscriptions—from the very exclusive, premium Minervini platform to Gil Morales and Kevin Marder. I have to say Morpheus is the most reliable, stable, efficient, and fun to follow. Keep that good stuff going…thanks MTG team!”
– Edmund S. (Morpheus member from Germany)


